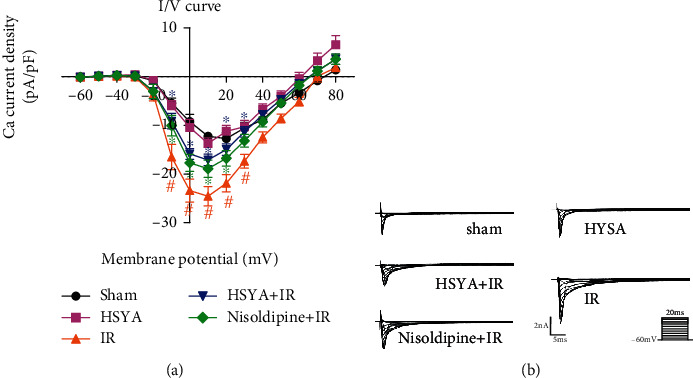
Figure 7.

Effect of HSYA on IR-induced elevation of calcium current in rats. After HSYA (16 mg/kg) administration and IR, patch clamp was performed. (a) I–V curve of the Ca2+ current was recorded. (b) Representative Ca2+ current traces are shown. #P < 0.05 vs. sham group (the color of # is the same as that of the curve); ∗P < 0.05 vs. IR group (the color of ∗ is same as that of the curve).
