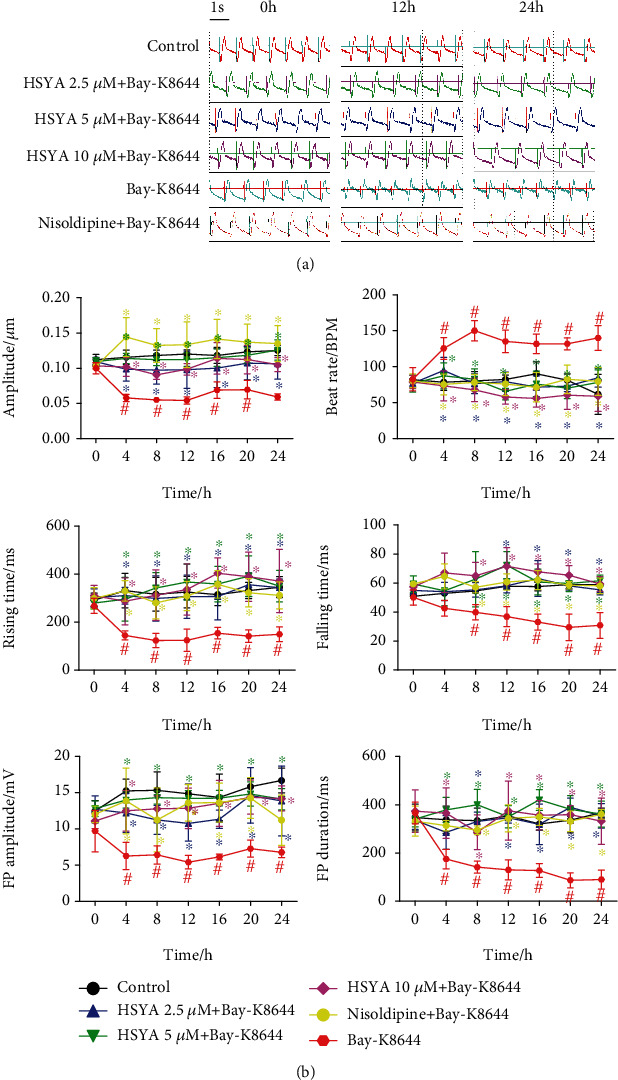
Figure 8.

Effect of HSYA on LTCC agonist-induced abnormal contraction and field potential signals in hiPSC-CMs. Following HSYA (2.5, 5, and 10 μM) treatment for 24 h, the impedance and field potential signals of hiPSC-CMs were monitored in real time during Bay-K8644 treatment. (a) Representative merged images of contraction and field potential signals for 5.4 s. (b) Quantification analysis of contraction amplitude, beat rate, rising time, falling time, FP amplitude, and FP duration. #P < 0.05 vs. control group (the color of # is the same as that of the curve); ∗P < 0.05 vs. Bay-K8644 group (the color of ∗ is same as that of the curve).
