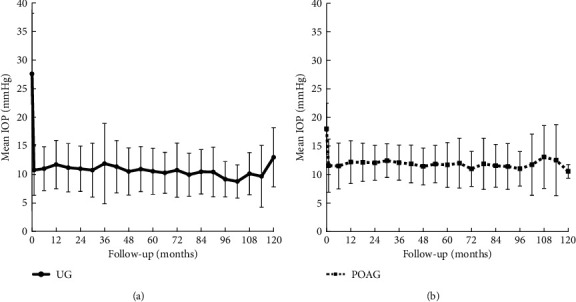
Figure 1.

Mean preoperative and postoperative IOP after MMC-TLE in the UG and POAG groups. (a). UG. (b). POAG. The decrease in the median IOP was significant at all time points compared with the baseline values in both groups (P < 0.05, by Student's t-test). The error bar whiskers represent the standard deviation.
