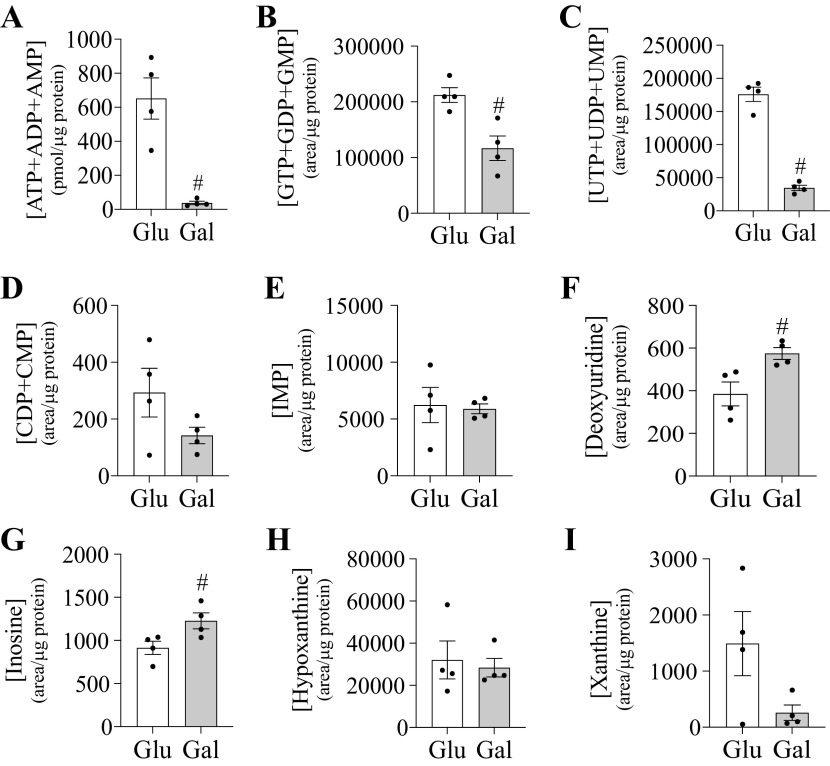
Figure 4.
Galactose impacts nucleotide levels in HepG2 cells. Metabolite level of nucleotide phosphates and related metabolites in HepG2 cells cultured in glucose or galactose medium for 4-5 weeks. Represented metabolites include ATP+ADP+AMP (A), GTP+GDP+GMP (B), UTP+UDP+UMP (C), CDP+CMP (D), IMP (E), deoxyuridine (F), inosine (G), hypoxanthine (H), and xanthine (I). #Indicates statistically significant differences between cells cultured with galactose compared with glucose (unpaired t-test, P < 0.05, n = 4, average ± SEM).

