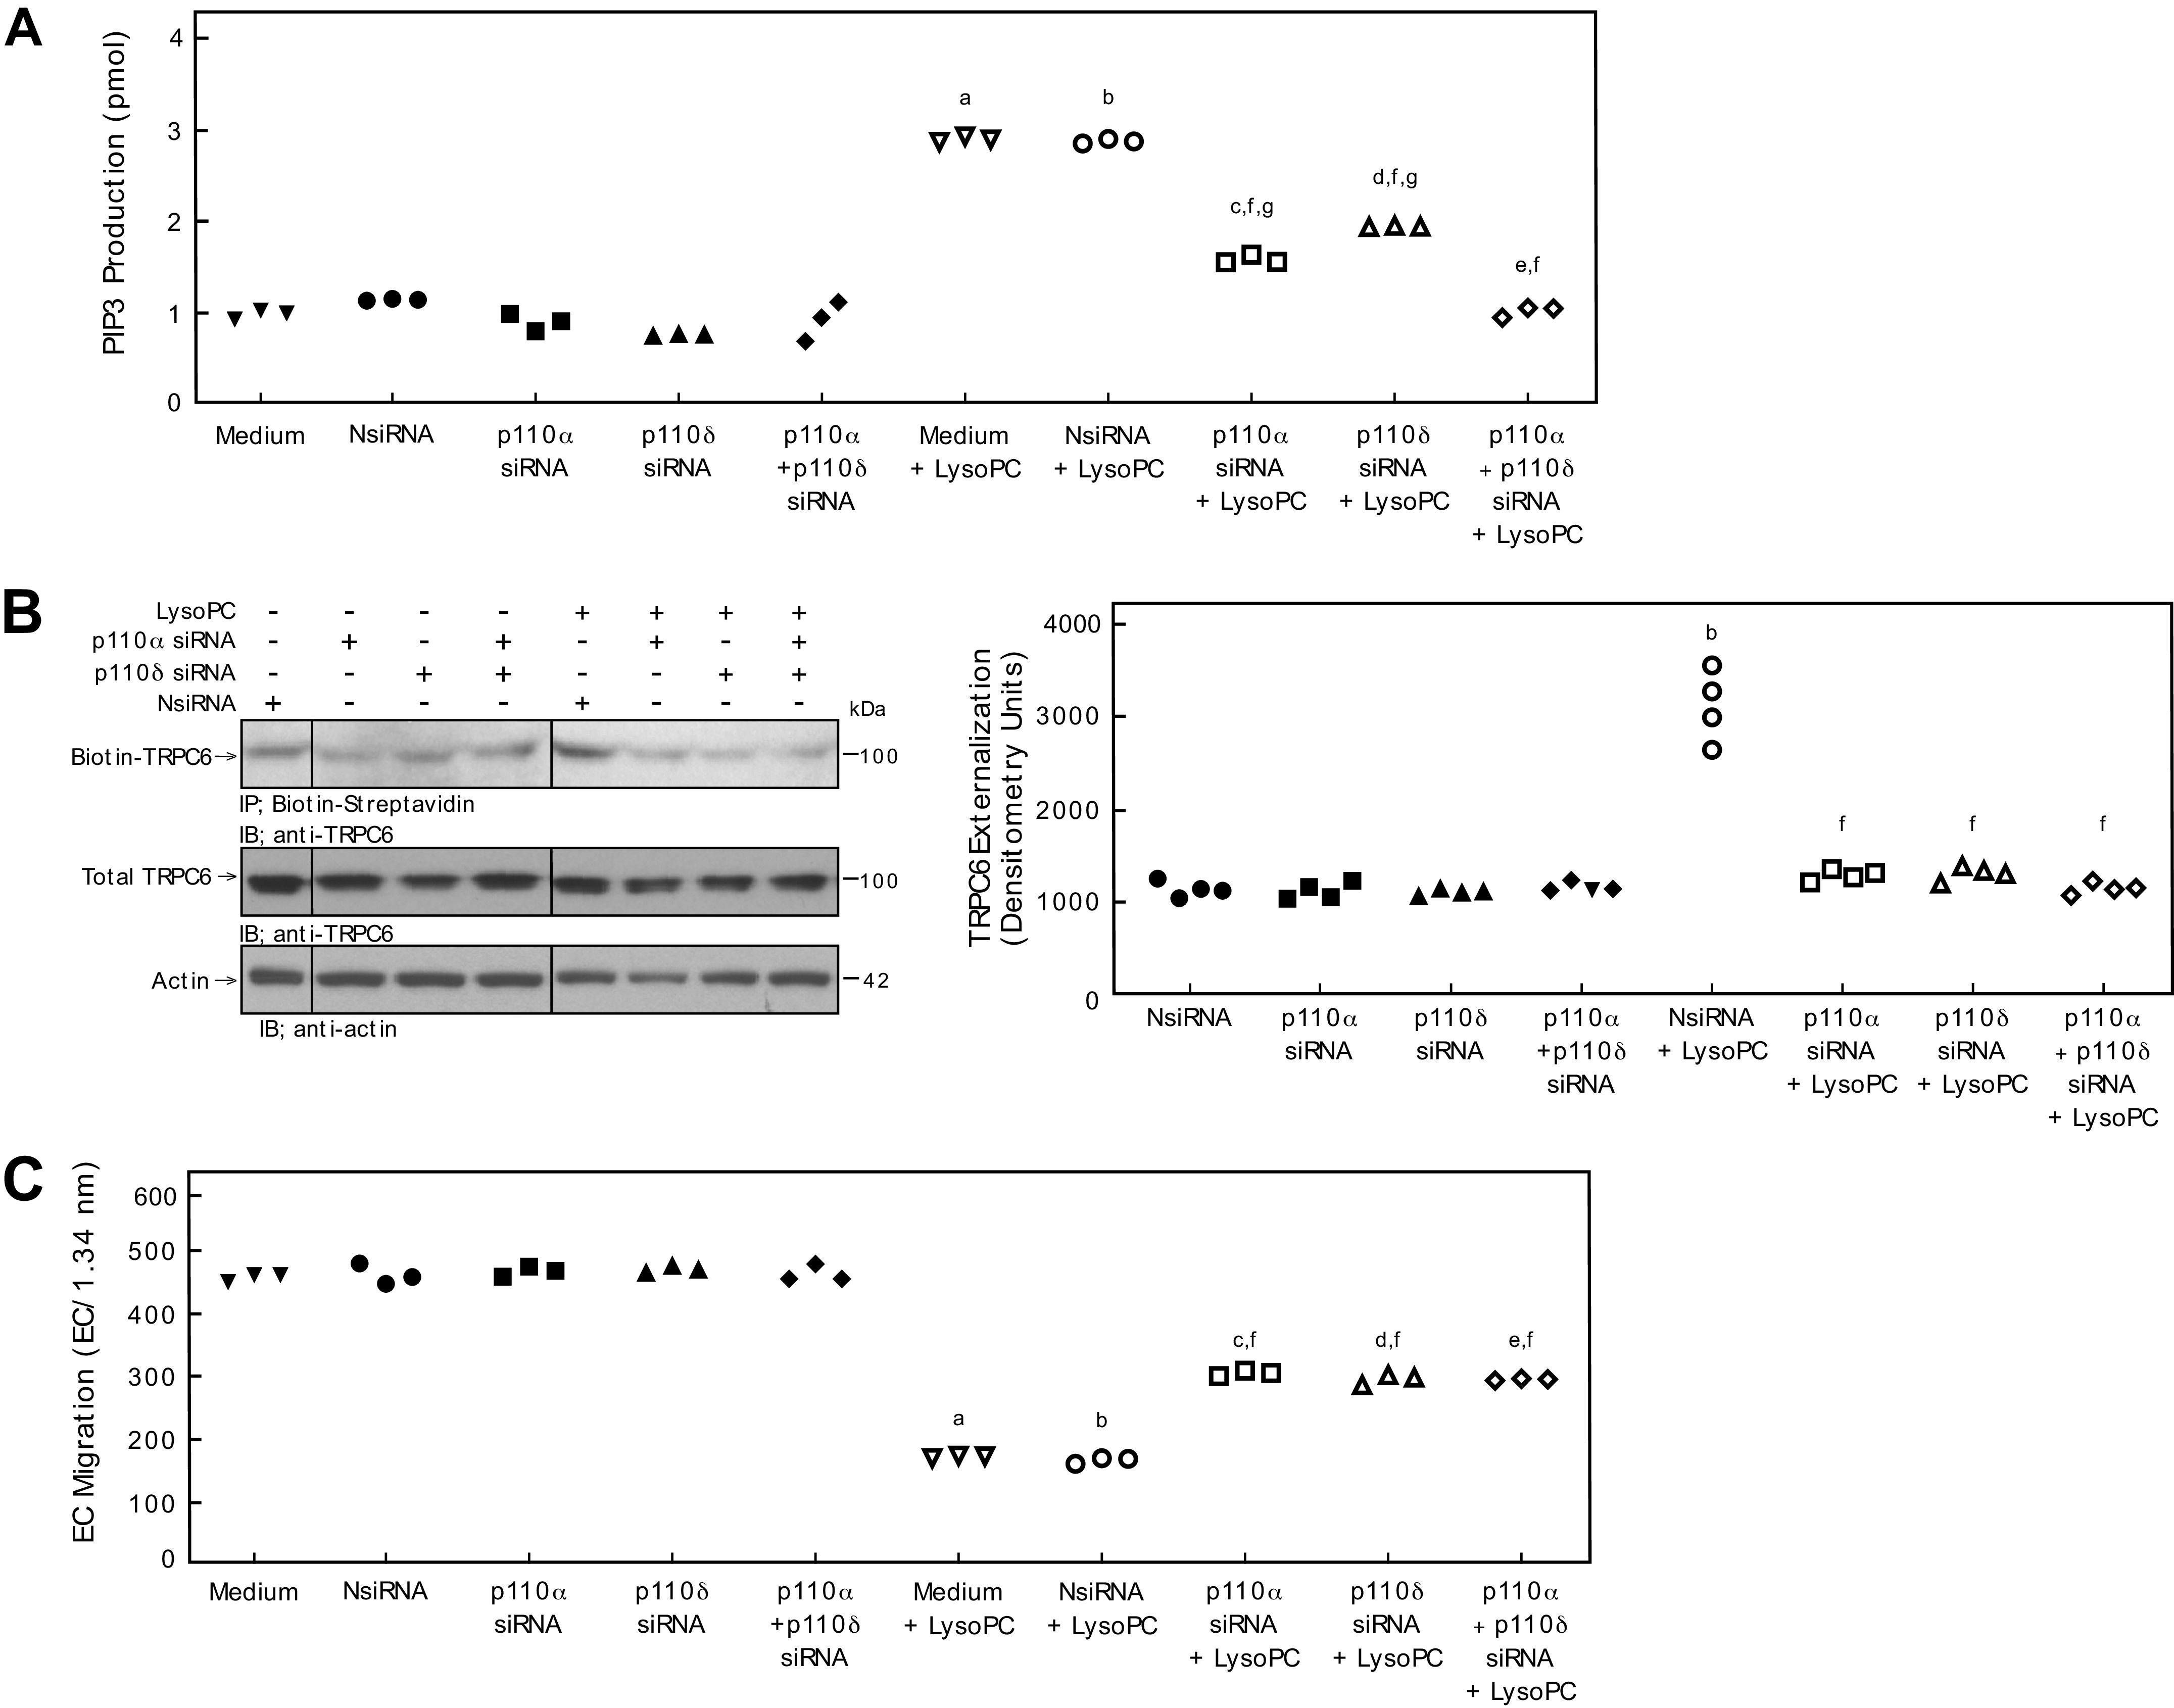
Figure 6.

Combined down-regulation of p110α and p110δ significantly decreases PIP3 production, but does not significantly decrease TRPC externalization or improve EC migration compared with p110α or p110δ alone. Bovine aortic ECs were transiently transfected with control siRNA (NsiRNA) (40 nmol/L), p110α siRNA (20 nmol/L), p110β siRNA (30 nmol/L), p110δ siRNA (20 nmol/L), p110γ siRNA (30 nmol/L), or p110α siRNA (20 nmol/L) + p110δ siRNA (20 nmol/L) for 24 h. A: PIP3 production in the presence or absence of lysoPC (12.5 μmol/L) was determined by ELISA and represented by scatter plot (n = 3 independent biological samples). B: Externalization of TRPC6 after down-regulation of p110α, p110δ, or p110α + p110δ (left panel) was detected by biotinylation assay and total TRPC6 by immunoblot analysis. Actin served as loading control (n = 4 independent biological samples). Black lines indicate lanes rearranged from the same gel. All bands are from the same gel. Densitometry measurements of Biotin-TRPC6 are represented in a scatter plot after down-regulation of p110α, p110δ, or p110α + p110δ (right panel) (n = 4 independent biological samples). C: ECs were made quiescent for 12 h. The migration assay was initiated, and the migration in the presence or absence of lysoPC (12.5 μmol/L) was assessed after 24 h. Results are presented as scatter plots (n = 3 independent biological samples). Statistical analysis for A–C performed using One-Way ANOVA with Tukey’s Multiple Comparisons Test (a. P < 0.001 compared with medium, b. P < 0.001 compared with NsiRNA, c. P < 0.001 compared with p110α siRNA, d. P < 0.001 compared with p110δ, e. P < 0.001 compared with p110α siRNA + p110δ siRNA, f. P < 0.001 compared with NsiRNA + LysoPC, g. P < 0.001 compared with p110α siRNA + p110δ siRNA + LysoPC).
