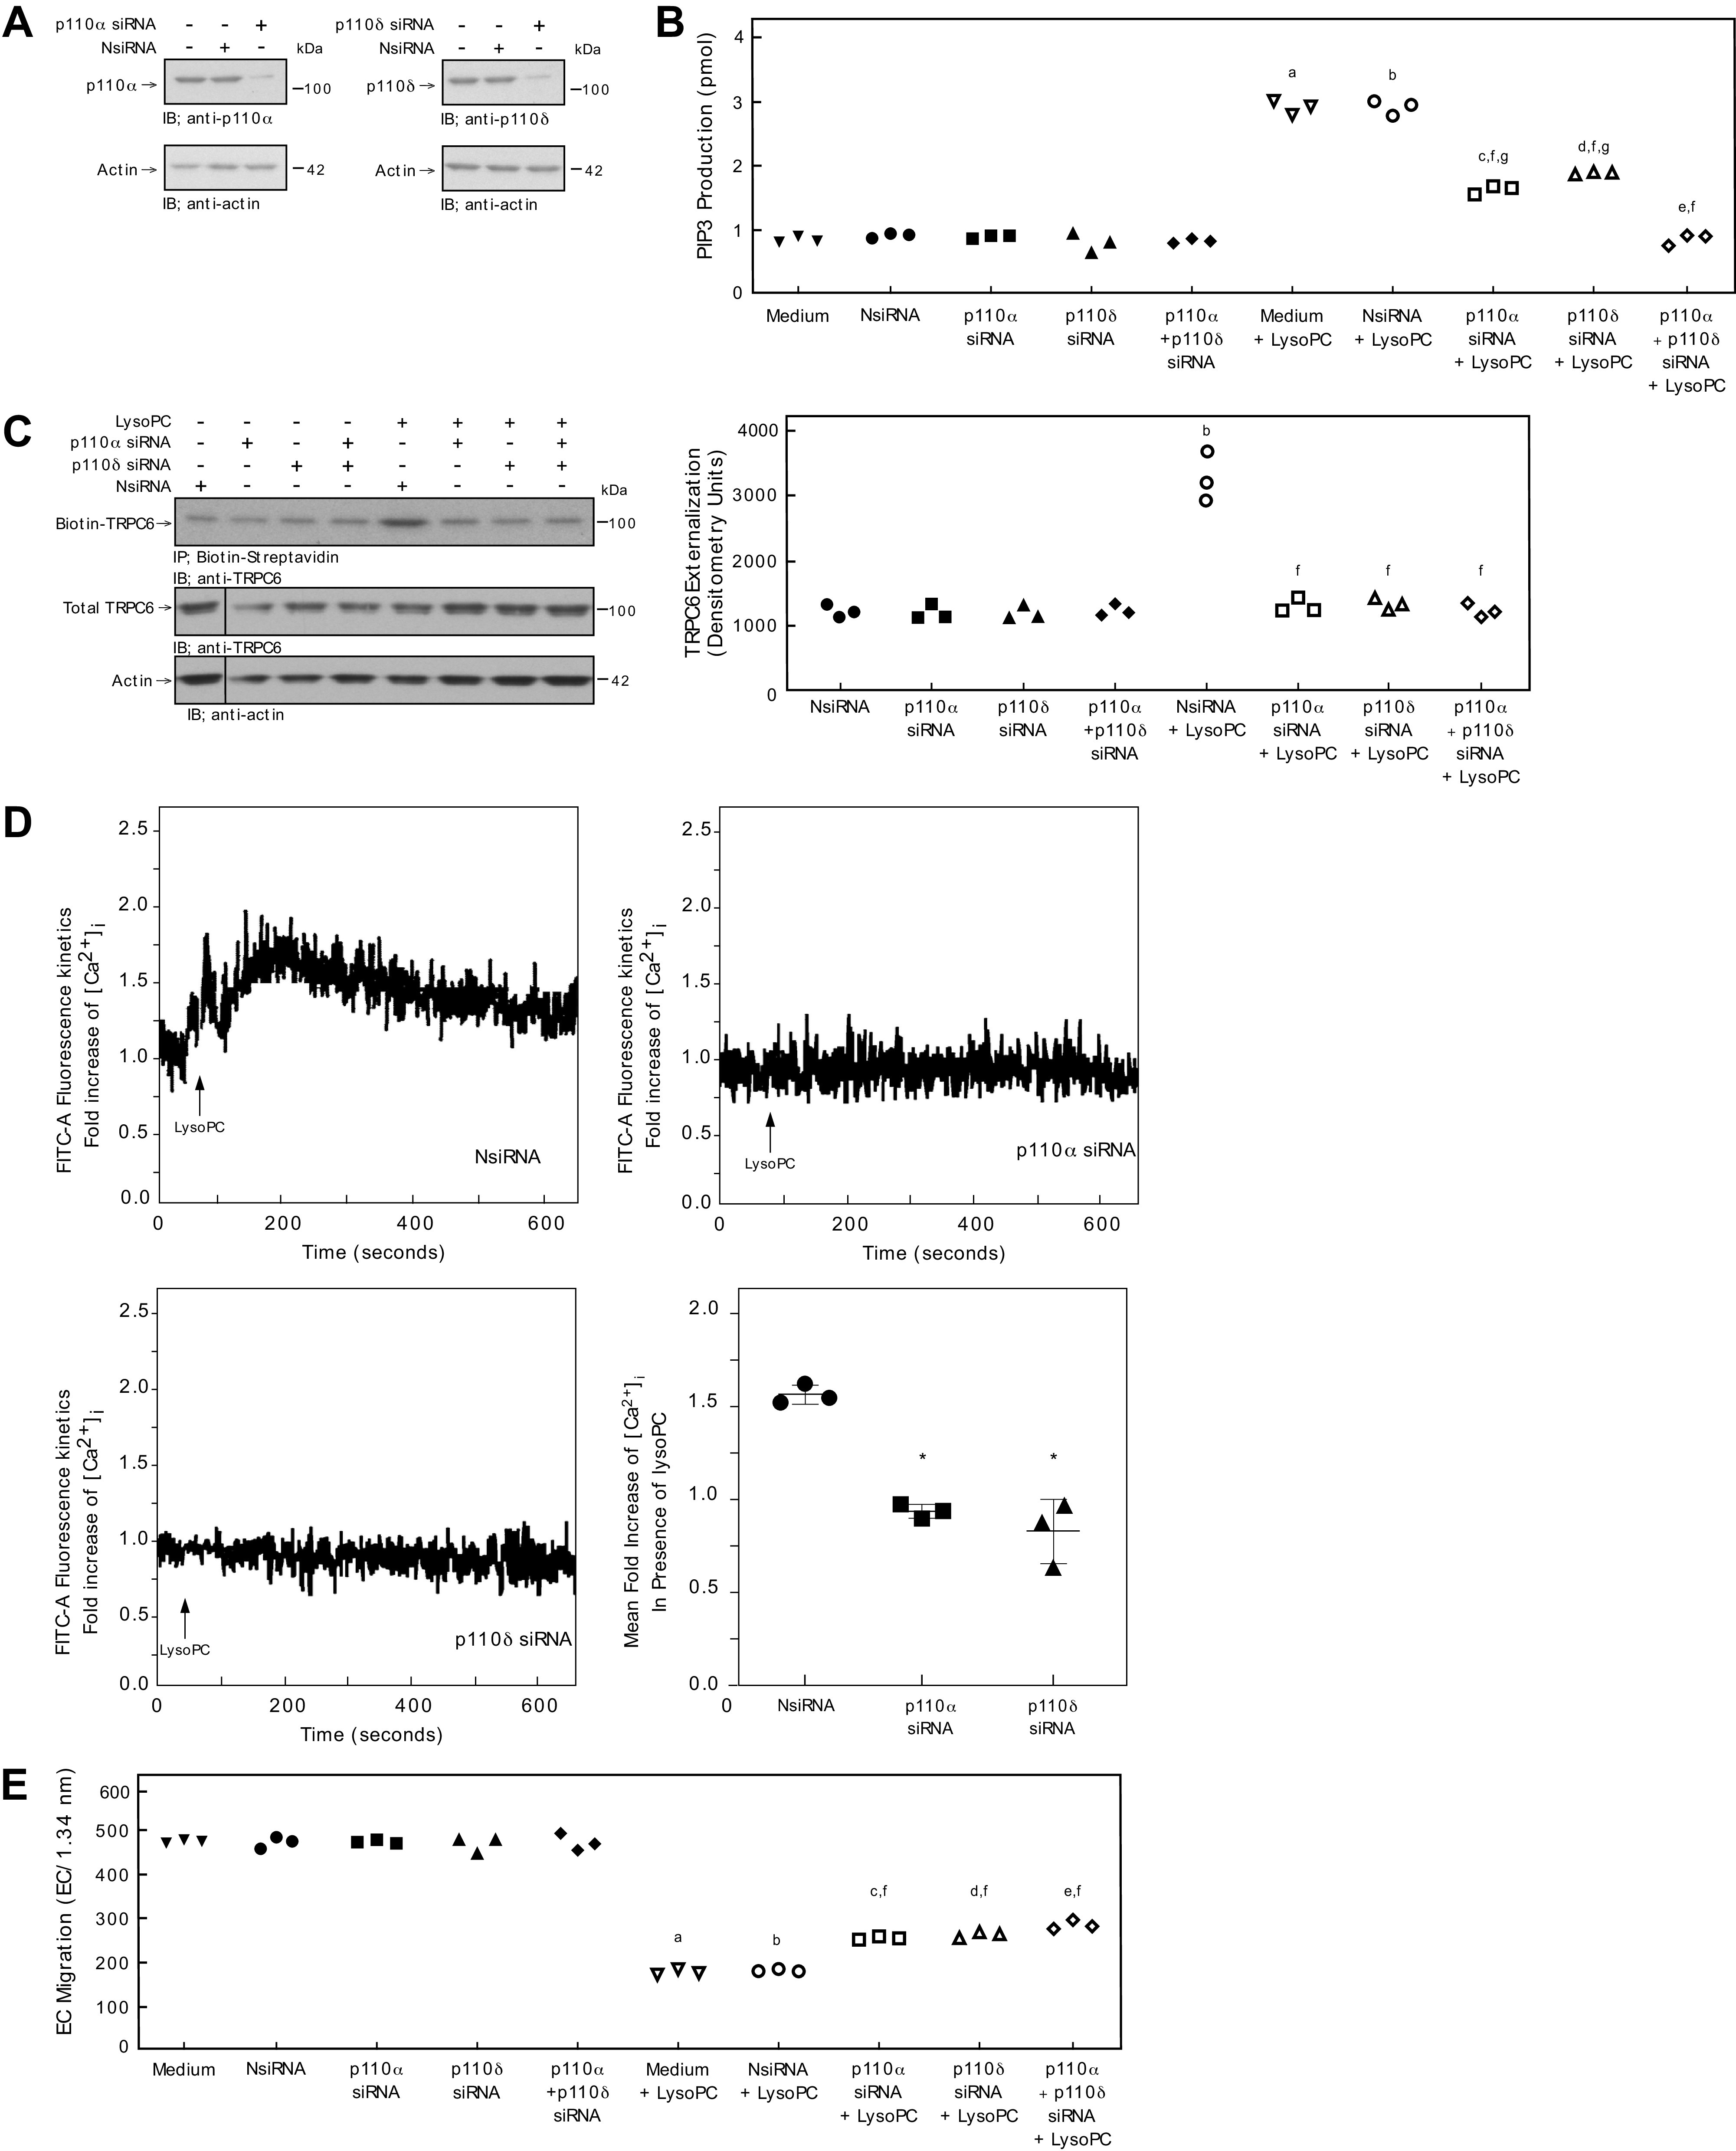
Figure 7.

Down-regulation of p110α or p110δ inhibits lysoPC-induced PIP3 production, blocks TRPC6 externalization, and partially restores EC migration in the presence of lysoPC in human EC. EAhy926 ECs were transiently transfected with NsiRNA (40 nmol/L), p110α siRNA (20 nmol/L), p110δ siRNA (20 nmol/L), or p110α siRNA (20 nmol/L) + p110δ siRNA (20 nmol/L) for 24 h. A: The siRNA was then removed. At 48 h after siRNA removal, the cells were lysed and p110α (left panel) or p110δ (right panel) was identified by immunoblot analysis. Actin served as the loading control (n = 3 independent biological samples). B: PIP3 production in the presence or absence of lysoPC (12.5 μmol/L) was determined by ELISA and represented by scatter plot (n = 3 independent biological samples). C: ECs were incubated with lysoPC (12.5 μmol/L) for 15 minutes. Externalization of TRPC6 after down-regulation of p110α, p110δ, orp110α + p110δ (left panel) was detected by biotinylation assay and total TRPC6 by immunoblot analysis. Actin served as loading control (n = 3 independent biological samples). Black lines indicate lanes rearranged from the same gel. All bands are from the same gel. Densitometry measurements of Biotin-TRPC6 are represented in a scatter plot after down-regulation of p110α, p110δ, or p110α + p110δ (right panel) (n = 3 independent biological samples). D: ECs were loaded with the FITC-conjugated fluorophore Calbryte 520 AM dye. The EC were suspended and loaded into the sort chamber of a BD FACSMelody cell sorter maintained at 37°C. After adjusting the baseline, lysoPC (12.5 μmol/L) was added. Using the kinetic reading mode at Ex/Em 490/525 nm, relative changes in [Ca2+]i after transfection with NsiRNA (top left panel), p110α (top right panel), p110δ (bottom left panel) were read (Representative images of n = 3 independent biologic samples). Fold increase of [Ca2+]i measured by difference in mean [Ca2+]i at baseline and after addition of lysoPC (12.5 μmol/L) presented as a dot whisker (bottom right panel) (n = 3 independent biological samples). E. ECs were made quiescent for 12 h. The migration assay was initiated, and the migration in the presence or absence of lysoPC (12.5 μmol/L) was assessed after 24 h. Results are presented as scatter plots (n = 3 independent biological samples). Statistical analysis for B, C, and E performed using One-Way ANOVA with Tukey’s Multiple Comparisons Test.(a. P < 0.001 compared with medium, b. P < 0.001 compared with NsiRNA, c. P < 0.001 compared with p110α siRNA, d. P < 0.001 compared with p110δ, e. P < 0.001 compared p110α siRNA + p110δ siRNA, f. P < 0.001 compared with NsiRNA + LysoPC, g. P < 0.001 compared with p110α siRNA + p110δ siRNA + LysoPC). Statistical analysis for D performed using One-Way ANOVA with Dunnett’s Multiple Comparison Test against NsiRNA (*P < 0.001 compared with NsiRNA).
