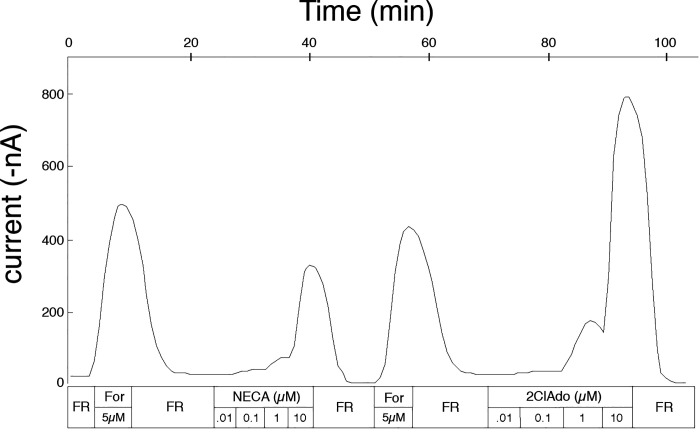
Figure 3.
Representative tracing for the determination of the concentration response profile for the shark A0 adenosine receptor. A total of 4 oocytes were used for the determination of the concentration response reported in the main text. Three oocytes, including results from 1 representative shown in the figure, were exposed to multiple sequences of incremental concentrations of N-ethyl-carboxyl adenosine (NECA), 2-chloroadenosine (2ClAdo), and R-phenyl-isopropyl adenosine (R-PIA; not shown), while the fourth was used for the study of R-PIA exclusively. After any stimulation of the oocytes [with forskolin (For) or adenosine analogs], oocytes were returned to basal levels by perifusion with frog Ringer solution (FR).

