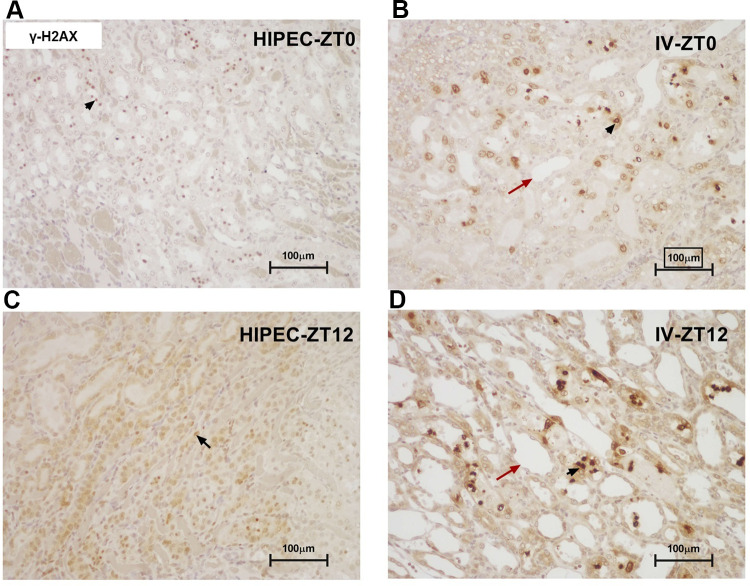
Figure 4.
Representative microphotographs of anti-γ-H2AX-stained kidney sections, illustrating samples from: (A) group receiving HIPEC with cisplatin at 08:00 (ZT0), (B) group receiving IV cisplatin at 08:00 (ZT0), (C) group receiving HIPEC with cisplatin at 20:00 (ZT12), (D) group receiving IV cisplatin at 20:00 (ZT12). Black arrows: positively stained nuclei; red arrows: cystic tubular changes (×200).

