Figure 6.
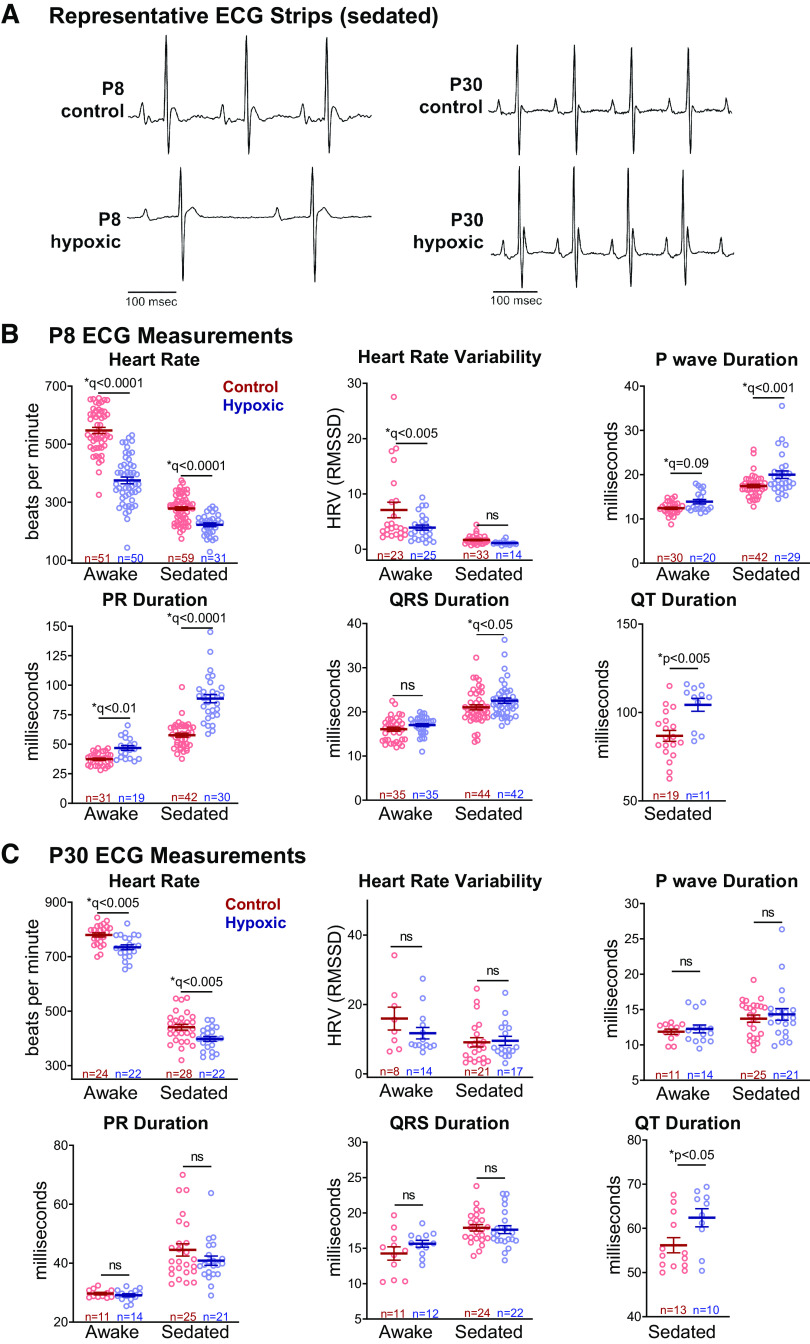
In vivo electrocardiogram measurements. A: representative electrocardiogram (ECG) traces (isoflurane-sedation shown). B: awake hypoxic postnatal day (P)8 animals had lower heart rates compared to control, and hypoxia prolonged ECG intervals, consistent with slowed conduction speed. Sedated hypoxic P8 animals exhibited slower heart rate and conduction slowing in most ECG parameters compared with control. C: at P30, most ECG measurements had normalized or improved. Hypoxic animals had slight bradycardia and longer QT intervals under isoflurane-sedation. Biological replicates are shown. Data expressed as means ± SE. *q < 0.1 hypoxic versus control, two time points assessed by two-way ANOVA with multiple comparisons testing (0.1 FDR). *P < 0.05 hypoxic versus control via two-tailed t test. Due to motion artifact, only clearly discernable ECG parameters were included in the analysis. ns, not significant.

