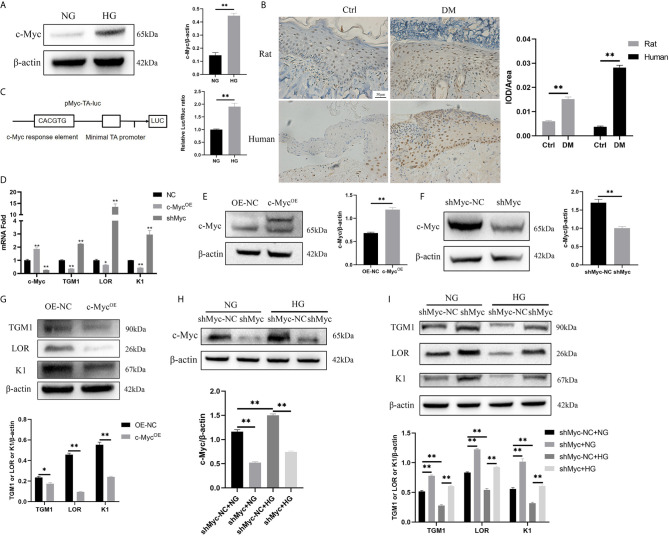
Figure 2.
High glucose inhibits differentiation by increasing the expression and transcription activity of c-Myc (A, B) c-Myc expression was analyzed by western blot (A) and immunochemistry (B). Magnification: ×200, Scale bar = 50 μl. (C) Schematic illustration of the c-Myc transactivation assay. 293T cells were cultured with high glucose or normal glucose for 5 days and then transfected with 500 ng pMyc-TA-luc and 50 ng Renilla. Firefly and Renilla luciferase activities were measured 36 h after transfection. (D) mRNA levels of c-Myc, TGM1, LOR, and K1 in HaCaT cells with c-Myc overexpression or knockdown were analyzed by PCR. (E, F) c-Myc protein level after c-Myc overexpression (E) or knockdown (F) was analyzed by western blot. (G) Protein levels of TGM1, LOR, and K1 in HaCaT cells with c-Myc overexpression were analyzed by western blot. (H, I) Protein levels of c-Myc (H), TGM1, LOR, and K1 (I) in HaCaT cells with c-Myc knockdown in the NG or HG condition were analyzed by western blot. OE-NC, the negative control of c-Myc overexpression. shMyc-NC, the negative control of c-Myc knockdown. Data were shown as the mean ± SEM measured in triplicate from three independent experiments. ANOVA followed by Tukey’s multiple comparisons test were performed to analyze the differences. *P < 0.05, **P < 0.01.

