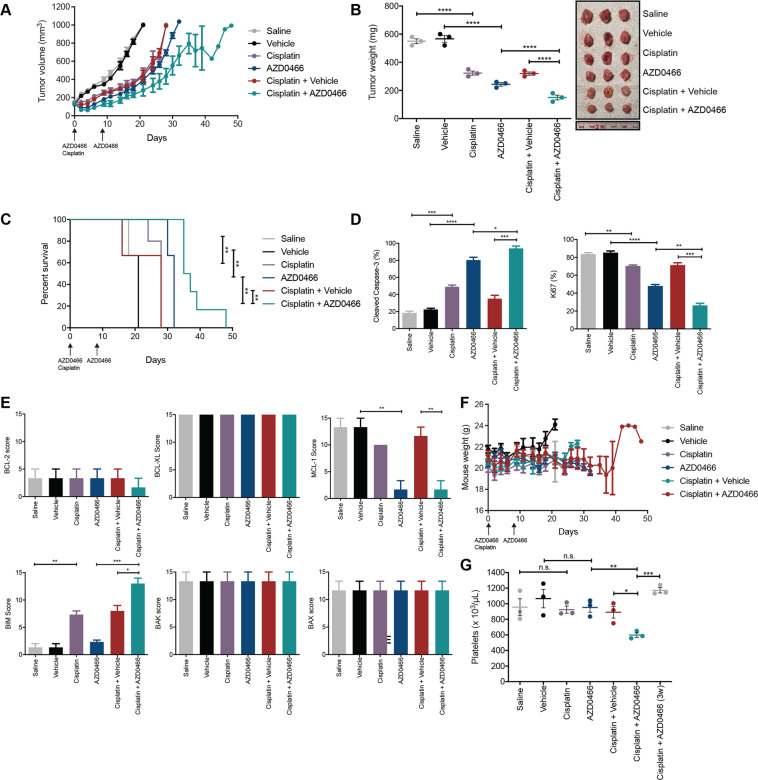
Fig. 4. AZD0466 treatment results in tumor growth control of MPM xenografts.
A MSTO-211H xenograft tumor volumes measured during and following treatment with AZD0466 (100 mg/kg, days 1 and 8, IV) and Cisplatin (4 mg/kg, day 1 IP), the combination, or appropriate controls. B Tumor masses at Day 19 from start of treatment. Each point is the mass of an individual tumor (photographed) with the bar indicating the mean ± SEM (n = 3) and significance determined by Student’s t-test (unpaired). C Kaplan–Meier survival curves of mice treated with AZD0466, Cisplatin and combinations of both, with relevant vehicle controls. Survival endpoint was when tumors reached 1000mm3 as dictated by the ethics approval associated with this experiment. Significance determined by Log-rank (Mantel–Cox test). D Immunohistochemistry analysis of tumors for cleaved Caspase-3 (CC3) and Ki67. Values represent the mean % postively stained cells for each antibody in five different fields of view. Data are mean ± SEM (n = 3), significance determined by Student’s t-test (unpaired). E Effect of AZD0466 and Cisplatin treatment on indicated BCL-2 family protein expression determined by immunohistochemistry (H-scores) on tumors harvested at Day 19 for indicated BCL-2 family members. Sections were scored for staining by each antibody in 5 different fields of view. Data are mean ± SEM (n = 3 tumors per group), significance determined by Student’s t-test (unpaired). F Body weights of mice were measured during and after the treatment period. Data represent mean ± SEM (n = 6–10). G Platelet counts (units per μL blood) determined 48 h post AZD0466 or vehicle dosing on Day 10 in all treatment groups and in Cisplatin plus AZD0466 treated mice 3 weeks (3w) post start of the treatment phase. Data is mean ± SEM (n = 3 mice per group), significance determined by Student’s t-test (unpaired).

