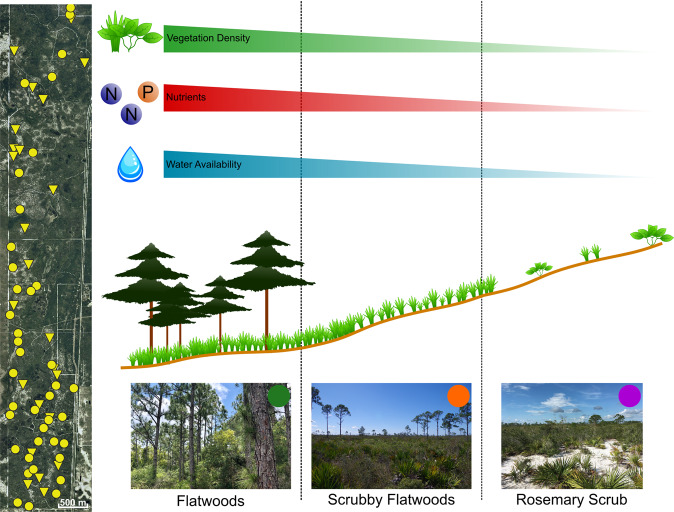
Fig. 1. Schematic of sampling sites and stress gradients.
(Left) Map of replicate stress gradient sampling sites at Archbold Biological Station, Venus, FL, USA (scale bar, 500 m). Dots indicate locations of the 40 replicate stress gradients from which soil samples were collected in the six environments (2 soil depths × 3 habitat types), and triangles represent 24 additional rosemary scrub sites that were sampled. (Right) Diagram of environmental gradient from low stress (flatwoods) to intermediate stress (scrubby flatwoods) to high stress (rosemary scrub). Images are examples of each habitat and have colored dots that represent habitat IDs used in the rest of this work (Photo Credits: D. Revillini, B. Almeida).

