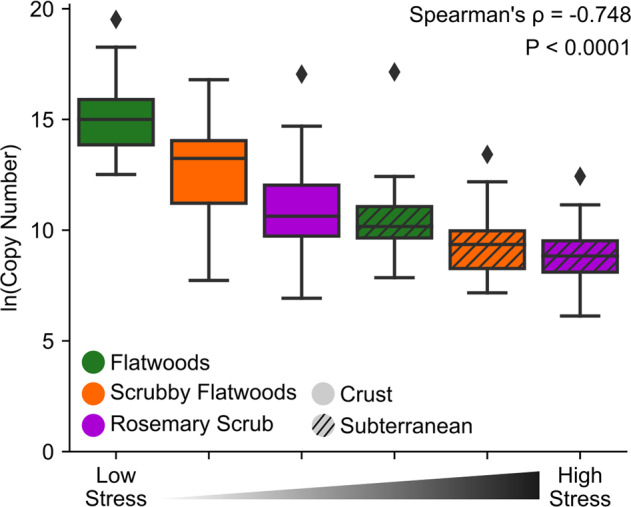
Fig. 2. Quantifying microbial stress.

Estimation of microbial stress by prokaryotic abundance in different habitat/depth combinations. Graph depicts natural log of the number of 16S_V4 primer target sites (i.e., number of prokaryotes) in soil DNA extractions. X-axis represents the categorical stress rankings of the six environments along the stress gradient. P value is derived from a Spearman’s Correlation test. Detailed statistics are available in Supplementary Table 3.
