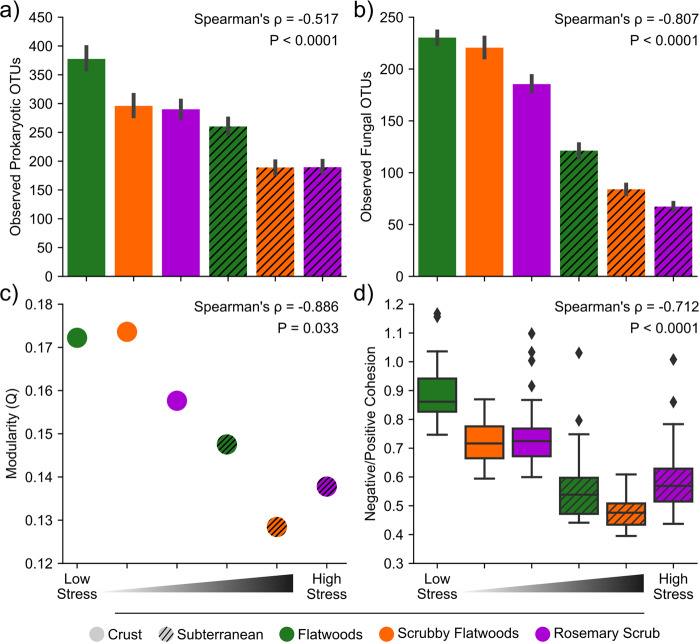
Fig. 3. Characterizing microbial diversity and network properties across the stress gradient.
a, b Decrease in prokaryotic (a) and fungal (b) community richness (observed OTUs) across the stress gradient. Error bars depict standard error of the mean. c Decrease in modularity of microbiome networks across the stress gradient. A single value of modularity was calculated for each environment. d Decrease in ratio of negative:positive cohesion across the stress gradient. Box plots show inner quartiles and median negative:positive cohesion. Both negative correlations of modularity and negative:positive cohesion with stress are consistent with decreasing microbiome stability across the stress gradient. X-axis represents the categorical stress rankings of the six environments along the stress gradient. Detailed statistics are available in Supplementary Table 3.

