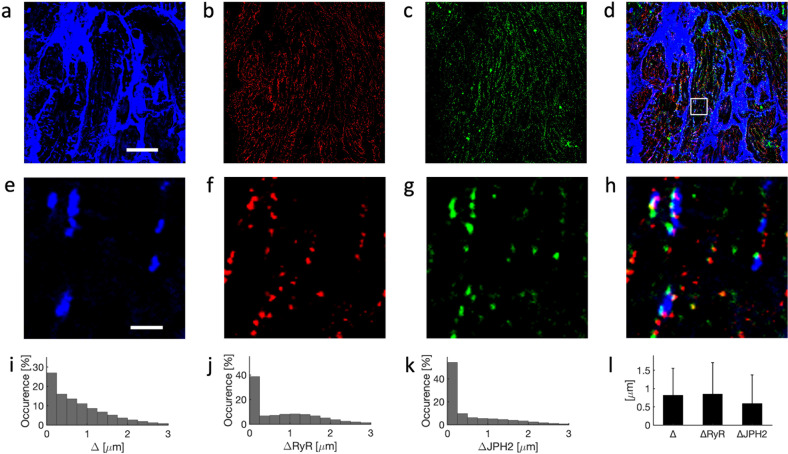
Fig. 4. Confocal microscopy of tissue from 19-year-old patient undergoing LVAD implantation.
Example images for labeling with a WGA, b anti-RyR, and c anti-JPH2 antibodies. d Overlay of a–c. e–h Zoom-ins of region in a–d marked with box in d. Histograms of sarcolemmal distances to i intracellular sites, j RyR clusters, and k JPH2 clusters. l Bar graph of distances with error bars identifying their standard deviations. Scale bar in a marks 20 µm and applies to b–d. Scale bar in e marks 2 µm and applies to f–h.

