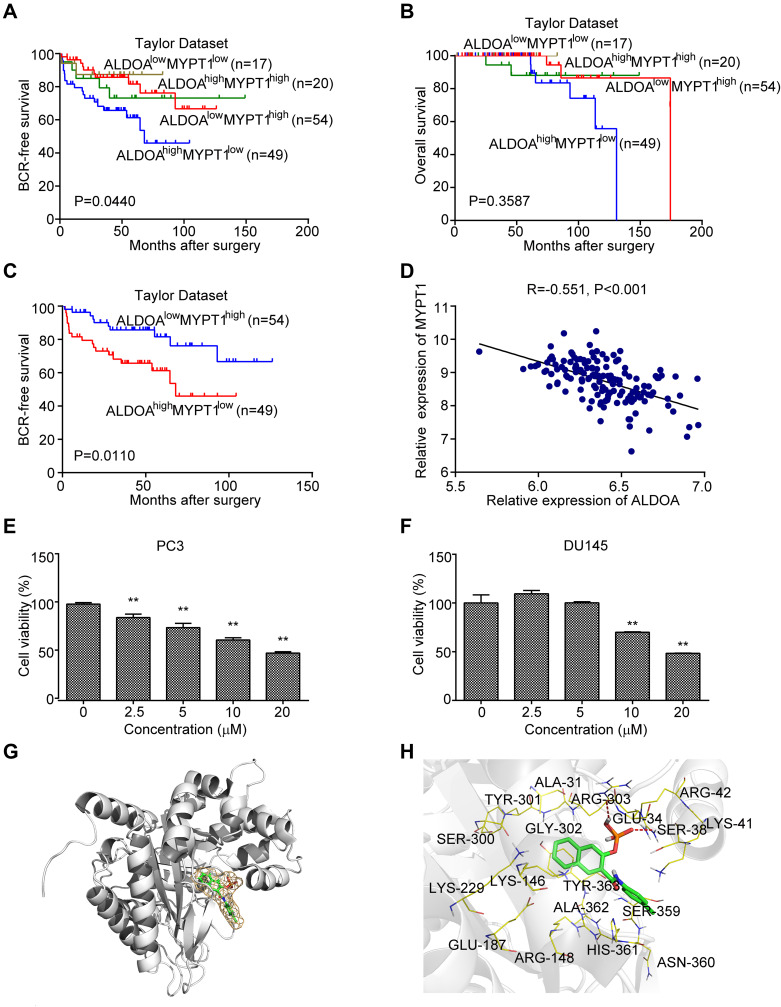
Figure 5.
ALDOA expression is negatively correlated with MYPT1 expression in the Taylor prostate cancer dataset. (A and B) Comparison of the overall biochemical recurrence-free survival rate and overall survival rate across different groups stratified according to MYPT1 and ALDOA expression. (C) There was a significant difference in the overall biochemical recurrence-free survival rate between the groups with low MYPT1 expression and high ALDOA expression and the groups with high MYPT1 expression and low ALDOA expression. (D) The expression of ALDOA in the PCa of the Taylor Dataset was negatively correlated with MYPT1 expression. (E) The cell viability of PC3 groups gradually decreased as the concentration of naphthol AS-E phosphate increased. (F) The cell viability of DU145 cells treated with a higher concentration of naphthol AS-E phosphate (10 and 20 μmoL/L) was lower than that of the control group. **P < 0.01 compared with the NC group. (G–H) Molecular docking results of naphthol AS-E phosphate and aldolase A. (G) The association between the higher affinity molecules and the acceptor molecules and hydrophobic and hydrophilic regions is shown in green and pink, respectively. (H) The mode of action between the molecule and the acceptor molecule showing the highest affinity.

