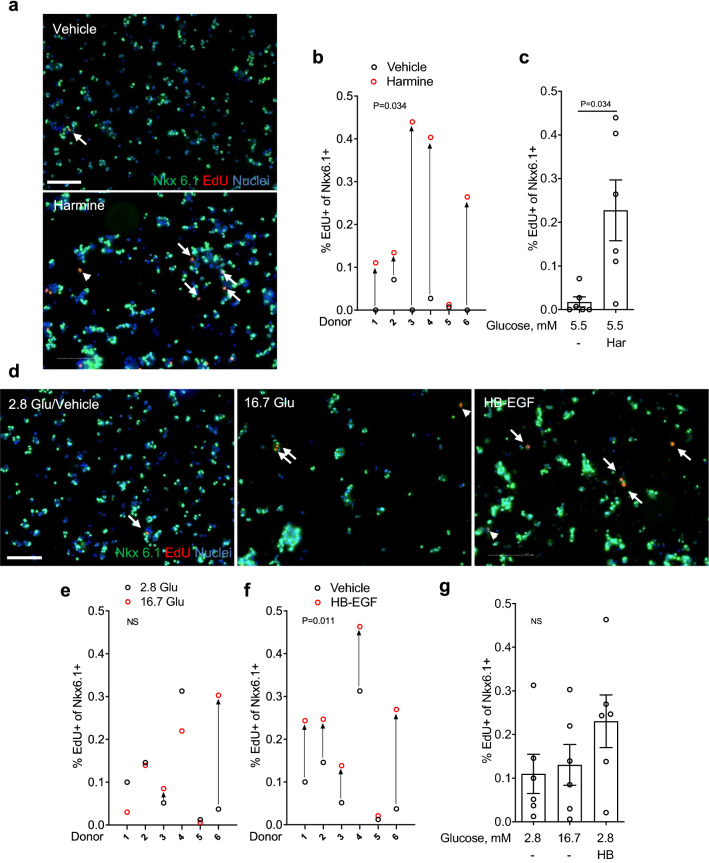
Figure 1.
Analysis of β-cell proliferation in dispersed human islets by immunocytochemistry for Nkx6.1. (a–g) Dispersed human islets were exposed to 5.5 mM glucose (Vehicle; a–c), 2.8 mM glucose (Vehicle or 2.8 Glu; d–g), harmine (10 μM) (Har; a–c), 16.7 mM glucose (16.7 Glu; d,e,g) and HB-EGF (100 ng/ml) (HB; d,f,g) for 72 h. EdU (10 μM) was added throughout. Proliferation was assessed by EdU staining and Nkx6.1 to mark β cells. Representative images of Nkx6.1 (green), EdU (red) and nuclei (blue) staining are shown (a,d). Arrows and arrowheads highlight EdU+/Nkx6.1+ and EdU+/Nkx6.1− cells, respectively. Scale bar, 100 μm. Images were acquired using an Operetta CLS with Harmony 4.5 software (https://www.perkinelmer.com/en-ca/product/operetta-cls-system-hh16000000). Between 1000 and 1500 Nkx6.1+ cells were counted for each sample. Proliferation is presented as the percentage of EdU+/Nkx6.1+ cells over the total Nkx6.1+ cells. Graphs showing cell proliferation of individual (b,e,f) and combined (c,g) donors were generated using GraphPad Prism 9 software (https://www.graphpad.com/scientific-software/prism/). Donor identifiers (Supplementary Table S1 online) are indicated. Significance was tested using paired t tests (b,c,e,f) or one-way ANOVA (g). P < 0.05 was considered significant. NS not significant.

