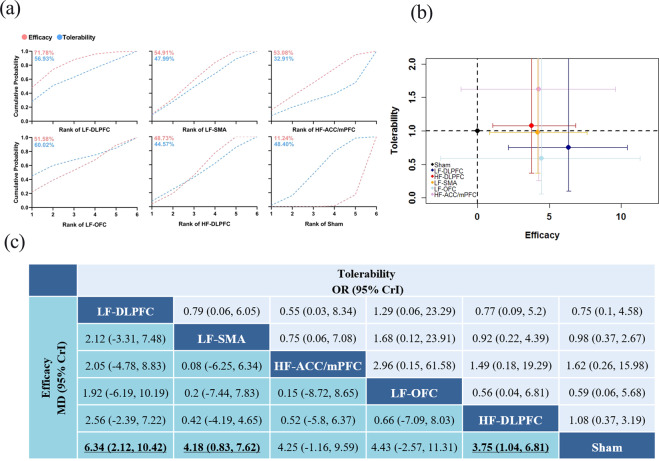
Fig. 4. Network meta-analysis of efficacy and tolerability.
a Ranking regarding efficacy and tolerability are assessed by the surface under the cumulative ranking curve (SUCRA) values. A larger SUCRA denotes a more effective and tolerable treatment strategy. b Each treatment strategy is represented by a node of a different colour. The abscissa represents symptom changes as a measure of efficacy (larger values denote more effective treatment strategies), and the ordinate represents drop-out rate as a measure of tolerability (smaller values denote more tolerable treatment strategies). The error bars represent the 95% credible intervals (CrIs). c The treatment strategies were ordered according to the surface under the cumulative ranking curve (SUCRA) for efficacy. Results are shown as the mean difference for symptom changes (lower triangle) and odds ratio for drop-out rates (upper triangle) estimated from the network meta-analysis comparing every pair of the six treatment strategies. Comparisons among the six treatment strategies should be read from left to right. For efficacy, an MD larger than 0 favours the intervention in the column. For tolerability, an OR <1 favours the intervention in the row. MD mean difference, OR odds ratio, CrI credible interval, LF-DLPFC low-frequency rTMS applied over the dorsolateral prefrontal cortex, HF-DLPFC high-frequency rTMS applied over the dorsolateral prefrontal cortex, LF-SMA low-frequency rTMS applied over the supplementary motor area, LF-OFC low-frequency rTMS applied over the orbitofrontal cortex, HF-ACC/mPFC high-frequency rTMS applied over the anterior cingulate cortex/medial prefrontal cortex.

