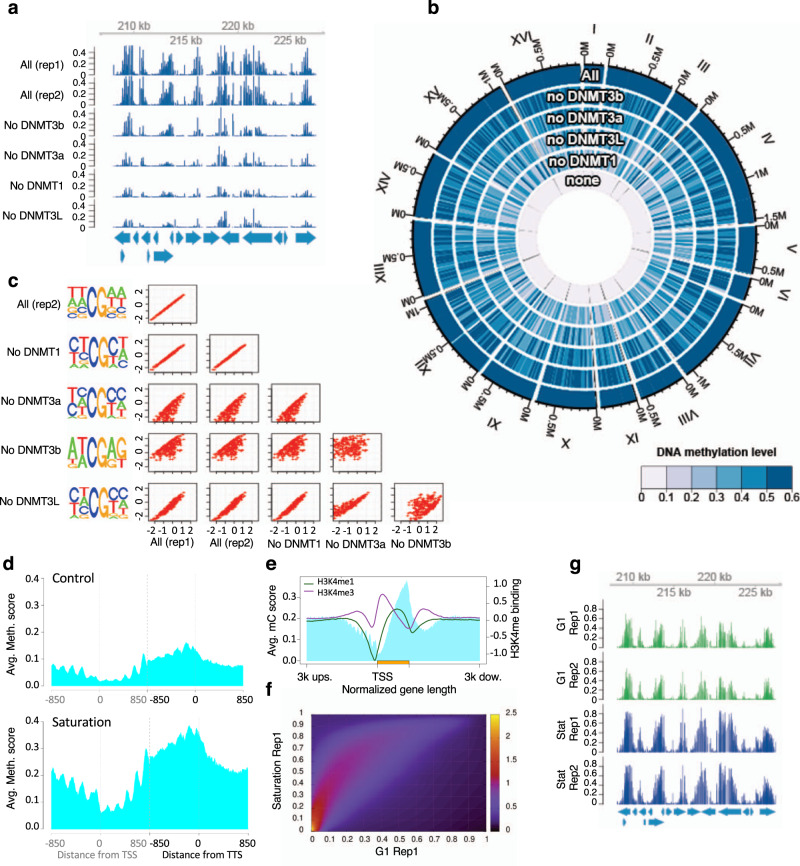
Fig. 1. Methylation pattern across several samples and along the gene body.
a The pattern of methylation is conserved in all samples as illustrated for this 20 kb region of chromosome III (208,135..227,458) where the level of methylation at each position is represented for two samples with the four DNMTs expressed and four samples with each combination of 3 DNMTs. All the samples come from replicating cells, synchronized in G1. b Circular plot comparing DNA methylation for the samples in a and a control without methylation (None). Methylation levels decrease when one DNMT is missing, the strongest effect being without DNMT1 and the mildest effect when DNMT3b is not present. c Correlation between the sequence effect on methylation status among samples with different combinations of three DNMTs. Motif effects are estimated from logistic regression (for details see Methods) and correlation plots are produced for each pair of samples. Motifs have nearly the same effect in the two replicates with all DNMTs induced (correlation coefficient is cor = 0.999) and when DNMT1 (cor = 0.996) or DNMT3L (cor = 0.954) are removed. In contrast, the estimated effect of some motifs on methylation probability is different in samples lacking DNMT3a (cor = 0.793) or DNMT3b (cor = 0.631). The left panels show the sequence logo of the motifs preferentially methylated in each sample. d, f, g Comparison of methylation pattern in samples in exponential phase and at saturation. d Average methylation level around TSS and TTS (850 bp upstream and downstream from each point). e Superposition of the pattern of DNA methylation and the pattern of H3K4 methylation along the average gene body (from 3 kb upstream TSS to 3 kb downstream TTS). DNA methylation preferentially occurs where H3K4 is not methylated. f Heatmap showing the correlation between methylation probabilities in samples in G1 and at saturation. g The pattern of methylation is conserved in samples in G1 and samples at saturation as illustrated for this 20 Kb region of chromosome III (208,135..227,458) where the level of methylation at each position is represented for 2 replicas of each condition, G1 (in green) and saturation (in blue).

