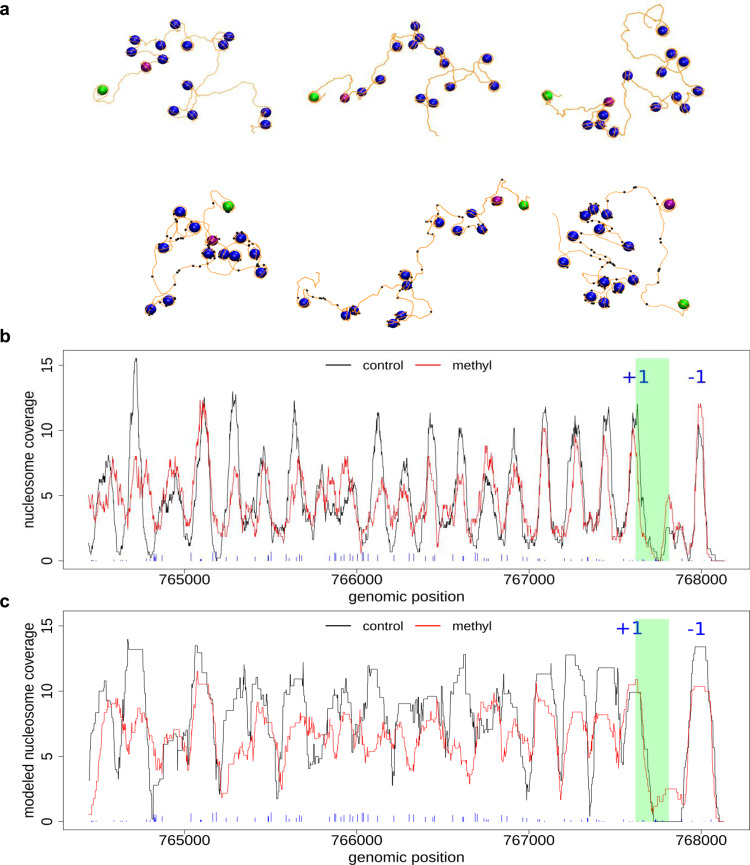
Fig. 3. Modeled nucleosome fibers from MNase-seq data.
a Modeled nucleosome fiber for (top panel) control and (lower panel) methylated cells. DNA base pairs are depicted as orange lines and nucleosomes as blue spheres (+1 and −1 nucleosomes are depicted in purple and green, respectively). Methylated regions (signal above 10% coverage) are highlighted as black balls. Experimental (b) and modeled (c) nucleosome position coverage for DUG2 gene (chromosome II). The TSS is highlighted in green and nucleosomes −1 and +1 are indicated. The blue sticks in the bottom correspond to methylated regions with their height proportional to methylation extent.

