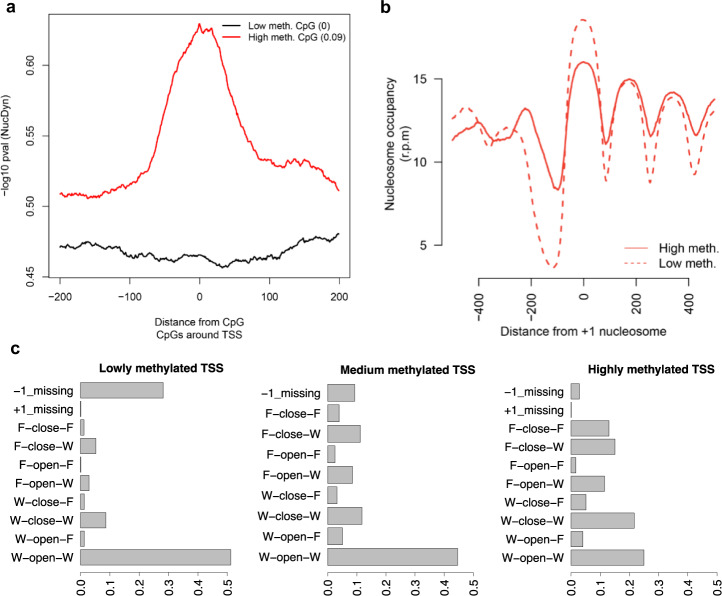
Fig. 4. Nucleosome dynamics upon methylation at promoters.
a NucDyn score around highly methylated (in red) and lowly methylated CpGs (in black) at promoters. b Nucleosome coverage around +1 nucleosome for genes with highest (top 10%, plain red lane), lowest (bottom 10%, dotted red lane) or medium (45–55%, doted black lane) level of CpG methylation around promoters. c Nucleosome architecture around promoters according to their methylation level.

