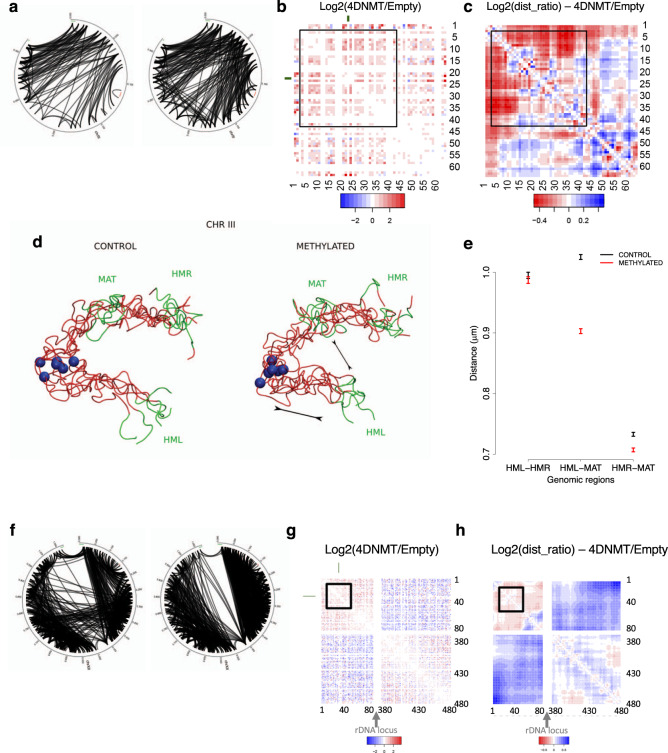
Fig. 7. Chromosome conformation changes under DNA methylation.
a Circos diagrams of significant interactions in chromosome III for the control (left) and methylated (right) samples. Heatmaps displaying the log2 ratio (Methylated/Control) of (b) the contact frequencies and (c) the distances in the ensemble for chromosome III. Blue indicates interaction with a higher frequency or shorter distance in the non-methylated control sample and red indicates interactions with a higher frequency or shorter distance in the methylated samples. d 3D representative structures for chromosome III highlighting the distance between MAT and HML loci shown in green. The centromere is represented as a blue sphere. e Average distances (±standard error) between mating type loci in the ensemble of structures for chromosome III (n = 260 and 482 structures for control and methylated samples, respectively). f Circos diagrams of significant interactions in chromosome XII for the control (left) and methylated (right) samples. Log2 ratio (Methylated/Control) of (g) the contact frequencies and (h) the distances in the ensemble for chromosome XII.

