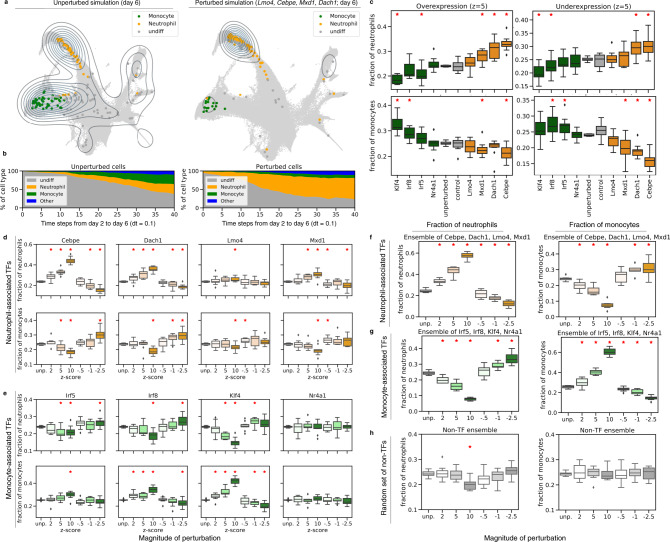
Fig. 3. In silico perturbations of hematopoiesis results in expected shifts in fate distribution.
a The distribution of cells at the final time-point generated by the model initialized with unperturbed cells (left) and cells with perturbations of Lmo4, Cebpe, Mxd1, and Dach1 upregulated (z = 10) during neutrophil differentiation (right). b Proportions of generated cell types from day 2 to 6 initialized with unperturbed cells (left) and cells with perturbations of transcription factors upregulated during neutrophil differentiation (right). c Fraction of neutrophil and monocyte cells at final time point with single-gene perturbations. Transcription factors involved in monocyte development are indicated in green, while transcription factors involved in neutrophil development are indicated in orange. Control genes (in gray) indicate experiments when perturbing genes from a random set of non-TFs as in (h) d, e, Individual genetic perturbations made to transcription factors involved in neutrophil and monocyte differentiation have an increased effect at higher dosages. f–g Ensemble perturbations of transcription factors involved in neutrophil (orange) and monocyte (green) differentiation have a stronger effect. h Ensemble random perturbations of non-transcription factors without proliferative signatures (gray). In c–h, boxplots are of randomly initialized unperturbed vs. perturbed simulations (n = 10) with 200 cells for each initialization, and red asterisks indicate Welch’s independent two-sided t-test at p < 0.05. Boxplots indicate median (middle line), first and third quartiles (box), and the upper whisker extends from the edges to the largest value no further than 1.5 × IQR (interquartile range) from the quartiles and the lower whisker extends from the edge to the smallest value at most 1.5 × IQR of the edge, while data beyond the end of the whiskers are outlying points that are plotted individually as diamonds.

