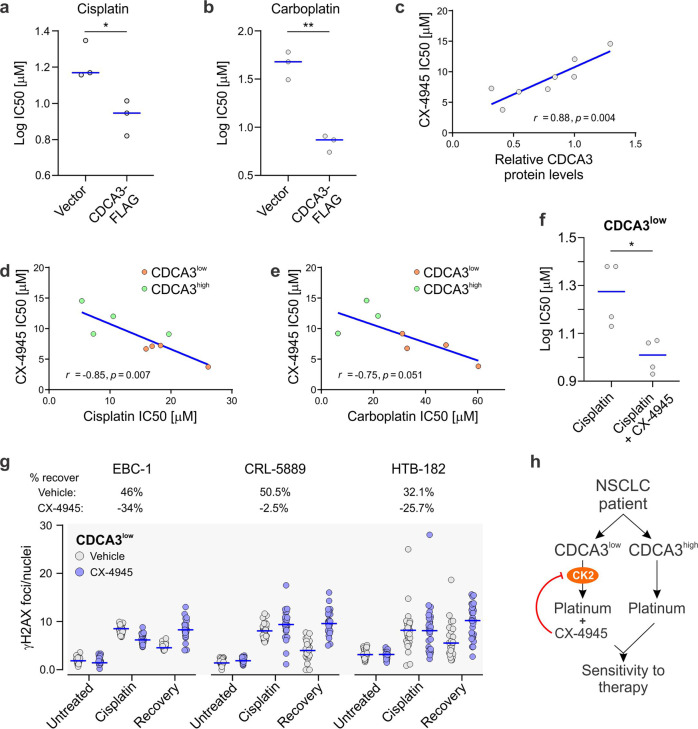
Fig. 6. Combining CK2 inhibitors with cisplatin in CDCA3low NSCLC.
a Beeswarm plots showing the impact of ectopic CDCA3 overexpression in CDCA3low NSCLC cell lines upon cisplatin dose responses. Blue line indicates median cisplatin IC50 value. (unpaired Student’s t test, *P = 0.0234). b Beeswarm plots showing the impact of ectopic CDCA3 overexpression in CDCA3low NSCLC cell lines upon carboplatin dose responses. Blue line indicates median cisplatin IC50 value. (unpaired Student’s t test, **P = 0.0012). a, b The CDCA3low cell lines used include EBC-1, CRL-5889 and HTB-182 cells. c Scatter plot showing linear regression analysis assessing correlation between CDCA3 protein levels, and in vitro CX-4945 sensitivity which is represented by IC50 values, as per Fig. 1g. CX-4945 IC50 values calculated dose responses indicated in Supplementary Fig. 4. Data points represent NSCLC cell lines. R and P values determined according to Pearson correlation. d Scatter plot assessing correlation between cisplatin and CX-4945 IC50 sensitivities with NSCLC cell lines with high (green) and low (orange) CDCA3 indicated. e Scatter plot assessing correlation between carboplatin and CX-4945 IC50 sensitivities with NSCLC cell lines with high (green) and low (orange) CDCA3 indicated. d, e Linear regression determined according to Pearson correlation with R and P values displayed. f Beeswarm plots showing the impact of CX-4945 IC25 concentrations upon cisplatin dose responses in NSCLC cell lines with low CDCA3 levels. Blue line indicates median cisplatin IC50 value. (unpaired Student’s t test, *P = 0.0138). g Beeswarm plots showing γH2AX foci count per nucleus determined from high throughput immunofluorescence microscopy of EBC-1, CRL-5889 and HTB-182 NSCLC cell lines with low CDCA3 protein levels (determined in Fig. 1g). γH2AX foci counts were determined in cell lines exposed to the presence (blue data points) or absence (grey data points) of CX-4945 and either cisplatin treated for 12 h (cisplatin) or untreated. Foci counts were also determined in recovering cells following treatment with cisplatin alone or in combination with CX-4945 following cisplatin treatment (recovery). Data points calculated as per Fig. 1h from n = 13–16 fields of view. Blue lines indicate median values. Percent recovery calculated by difference between 100% and ratio of recovery/cisplatin expressed as a percentage. h Schematic representing proposed strategy to use CDCA3 as a potential companion diagnostic for CX-4945 to improve the sensitivity of NSCLC tumours to platinum-based chemotherapy.

