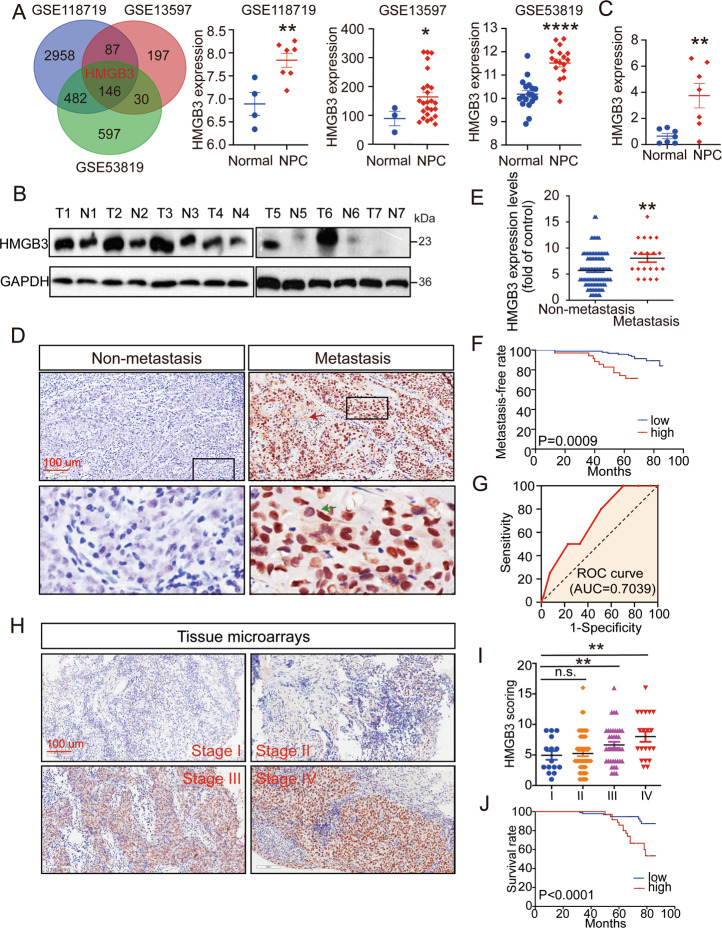
Fig. 1. Overexpression of HMGB3 is related to clinical outcomes of NPC patients.
A A Venn diagram of all upregulated genes among three GEO databases (GSE118719, GSE13597 and GSE53819) and the expression of HMGB3 in them. B HMGB3 protein levels in NPC tissues (n = 7) and normal nasopharyngeal epithelial tissue (n = 7) were examined by western blot. GD(GAPDH) was used as a loading control. C HMGB3 mRNA levels in NPC tissues (n = 7) and normal nasopharyngeal epithelial tissue (n = 7) were examined by qRT-PCR. D Representative IHC images of HMGB3 staining from NPC patients with or without metastasis and the black boxes indicate regions of pictures shown in the bottom two pictures. E Statistical comparison of HMGB3 score in the two groups. F The HMGB3 score was defined as low expression (1–8 points)(n = 94) and high expression (9–16 points)(n = 35). And the Kaplan–Meier analysis in the relationship between HMGB3 expression and metastasis of NPC. G The receiver operating characteristic (ROC) curve was plotted to validate the predictive accuracy of HMGB3 expression in metastasis NPC (ROC AUC = 0.7039). H Representative IHC images of HMGB3 staining in four TNM stages. I Statistical comparison of HMGB3 score in the four groups. J Kapla–Meier survival analysis of NPC patients’ overall survival by X-tile Software. The scale bar in 200× images represents 100 µm. Mean ± SD, *P < 0.05, **P < 0.01, ***P < 0.001, ****P < 0.0001, student’s test.

