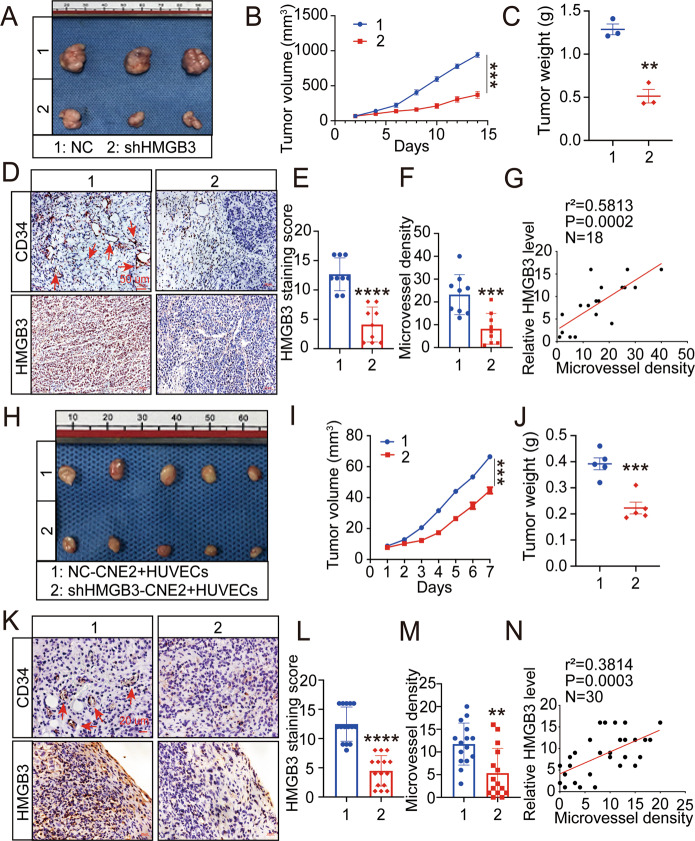
Fig. 4. Overexpression of HMGB3 correlates positively with MVD in NPC xenografts.
A, H Images of corresponding tumour xenografts. B, I Tumour volume in the two groups. C, J The weights of the excised xenografts. D, K Representative images of IHC for CD34 and HMGB3 in tissues collected from two groups of NPC xenografts. E, L Quantification of IHC staining score for HMGB3 expression. F, M Statistics of microvessel density. G, N Spearman correlation between HMGB3 score and MVD in tumour xenografts. Pearson correlation coefficient (r2) and P value are shown. The scale bar in 400× images represents 50 µm. The red arrows indicate microvessels. Mean ± SD, **P < 0.01, ***P < 0.001, ****P < 0.0001, student’s test.

