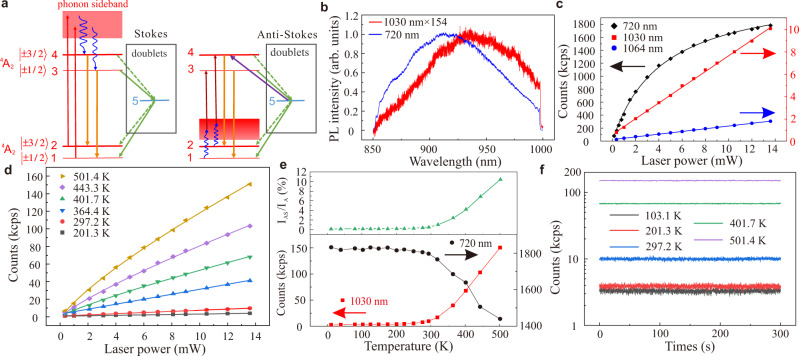
Fig. 1. The AS excitation model and the AS PL of VSi defects in 4H-SiC.
a Excitation schemes of VSi defects under Stokes excitation (left part) and anti-Stokes excitation (right part). The red (dark brown) arrows represent optical excitation from the ground state (labels 1 and 2) toward the excited states (labels 3 and 4) and the yellow arrows represent the associated spin-preserved radiative decay. The green arrows represent intersystem crossing (ISC) routes where dotted arrows mean weaker transitions than those represented by straight arrows. Blue wavy arrows show the phonon-related decay and excitation routes that are temperature dependent. The purple arrow represents a spin-flipping effective optical excitation from a metastable doublet state toward, selectively, to state 4. This is the key process in increasing the ODMR contrast upon anti-Stokes excitation, which is discussed in detail in the part of theoretical analysis. The energy differences are not linearly scaling for the sake of clarity. b The PL spectra of VSi defects under Stokes (blue) and AS (red) excitation at room temperature, respectively. The units for both cases are equal, and the Stokes excited PL spectrum intensity is approximately 154 times larger than that of anti-Stokes. c The counts of VSi defects as a function of laser power under Stokes (720 nm, black) and two different AS (1030 nm, red; 1064 nm, blue) excitations at room temperature, respectively. The corresponding lines represent the fits. d The counts of VSi defects with respect to the laser power under AS excitation (1030 nm) at various temperatures. e The bottom panel displays the maximal counts with 13.6 mW Stokes (black) and AS (red) excitations as a function of temperature, respectively. The top panel shows the corresponding temperature-dependent ratio of AS to Stokes counts. f The AS PL time trace at five different temperatures with a time bin of 100 ms.

