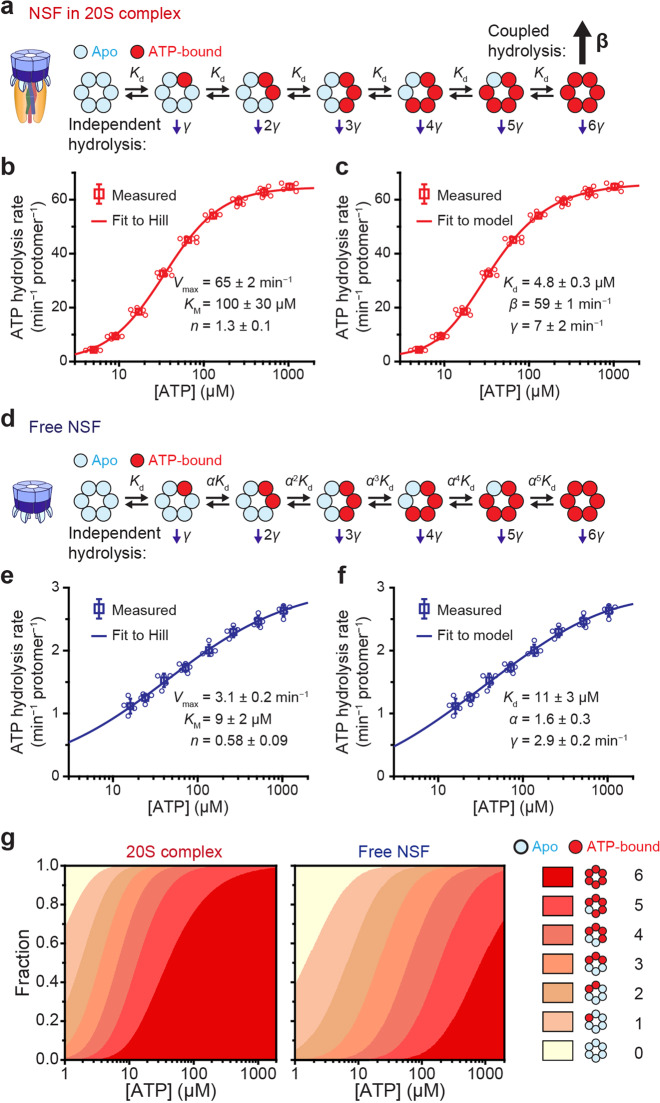
Fig. 6. Construction of the ATP hydrolysis model for the 20S complex.
a–f Models for ATP binding and hydrolysis of NSF in 20S complexes (a) and free NSF (d) with corresponding measurements of hydrolysis rates at varying ATP concentrations (b, c) and (e, f), respectively. The same data were fitted either with a Hill equation (b, e) or with the model (c, f) proposed in (a, d), respectively. KM, Kd: dissociation constant for ATP binding in subunits; γ: independent hydrolysis rate; β: coupled hydrolysis rate; α: scaling factor for Kd in the basal model; n: Hill coefficient; Vmax: maximum rate of ATP hydrolysis. For direct comparison, the two rates γ and β have been normalized per protomer and unit time (b, c). g The fraction of apo-state NSF hexamers to fully loaded hexamers in the 20S complex and to the free state, depending on ATP concentration. Error bars represent mean ± s.d. from six independent experiments for (b, c) and five independent experiments for (e, f). Source data are provided as a Source Data file.

