Figure 2.
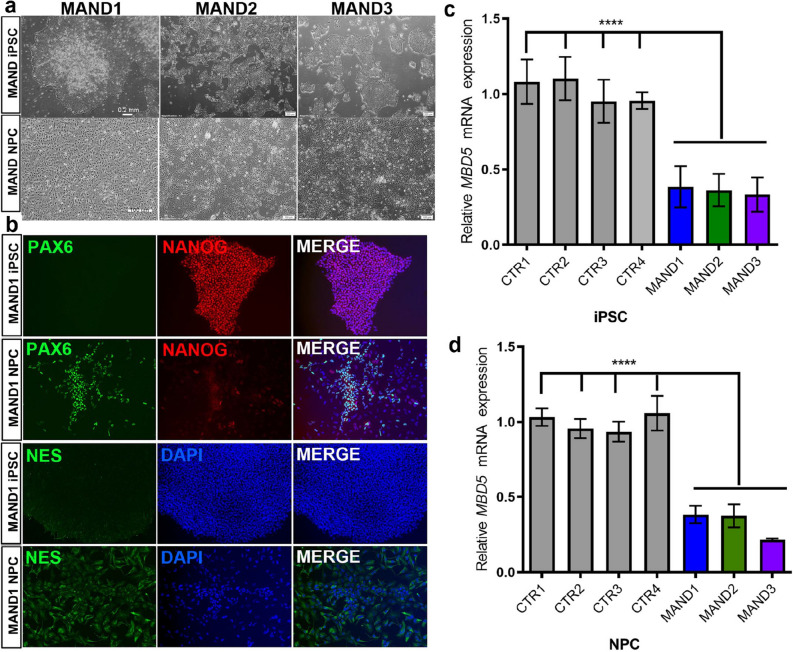
Generation of iPSC and NPC lines from individuals with MAND. (a) Bright-field images of undifferentiated iPSC lines from MAND1-3 (top row panel, l to r). Lower panel images are three NPC lines derived from MAND1-3 iPSC lines, respectively (l to r). After two weeks of neuronal induction, images were captured. Bars, 0.2 mm. (b) Immunostaining of MAND1 iPSC (1st row) and MAND1 NPC (2nd row) for neural progenitor cell marker PAX6 (1st column) and pluripotent cell marker NANOG (2nd column and 3rd for merged). Immunostaining of MAND1 iPSC and MAND1 NPC for NES (3rd and 4th rows, respectively). (c, d) qRT-PCR analysis confirmed ~ 50% reduction of MBD5 mRNA expression in MAND iPSC (c) and NPC lines (d) when compared with control iPSC and NPC lines, respectively. p < 0.0001. Quantification of the test gene (MBD5) was calculated relative to that of the housekeeping gene, GAPDH. All expression values were calculated relative to control levels set at 1.0. Error bars represent the SEM. ****p < 0.0001, n = 3 independent biological replicates performed in triplicate, GraphPad Prism 8.4.2 (graphpad.com).

