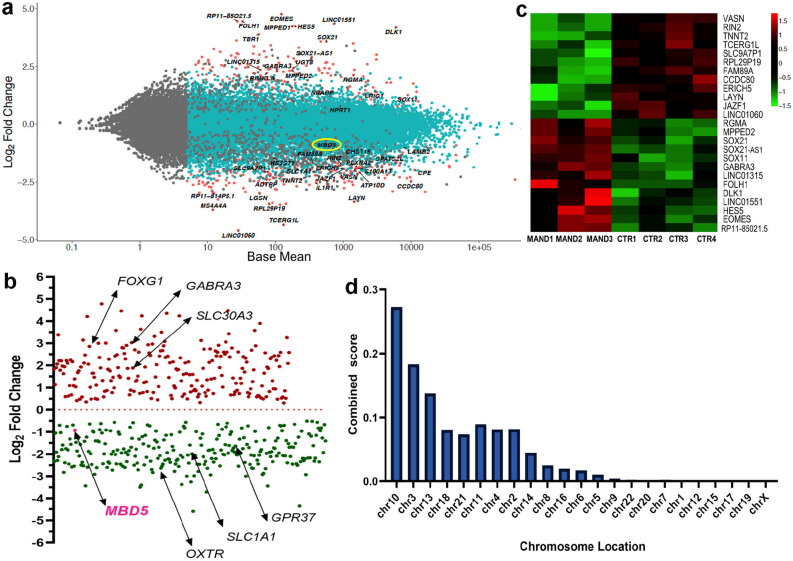
Figure 3.
Global transcriptome analysis of MAND NPC reveals alterations of multiple genes. (a) Scatter plot of fold-change in gene expression in MAND NPC lines versus control NPC lines. The gene expression difference between MAND and CTR NPC lines are shown in log2 fold changes in y-axis. Genes more highly expressed in MAND NPC than in CTR NPC have a positive fold-change, while the down-regulated genes are illustrated with negative fold change. X-axis represents mean normalized expression. Significantly differentially expressed genes are shown in red. Some representative differentially expressed genes are indicated, including MBD5 (circled in yellow). (b) MAND-associated 2q23.1 deletion results in both positive and negative effects on gene expression. The 468 differentially expressed genes are plotted based on their log2 fold changes in y-axis. Arrows point to MBD5 and other genes that are associated with autism spectrum disorder (ASD). (c) Heatmap for top 25 differentially expressed genes; the 12 most downregulated and 13 most upregulated genes in the MAND NPC compared with control NPC lines are shown. (d) The 468 differentially expressed genes are plotted based on chromosome region. Based on the combined score (Supplementary Data 2, Tab 1), the greatest number of differentially expressed genes were on chromosomes 10, 3, 13, 18, and 21.

