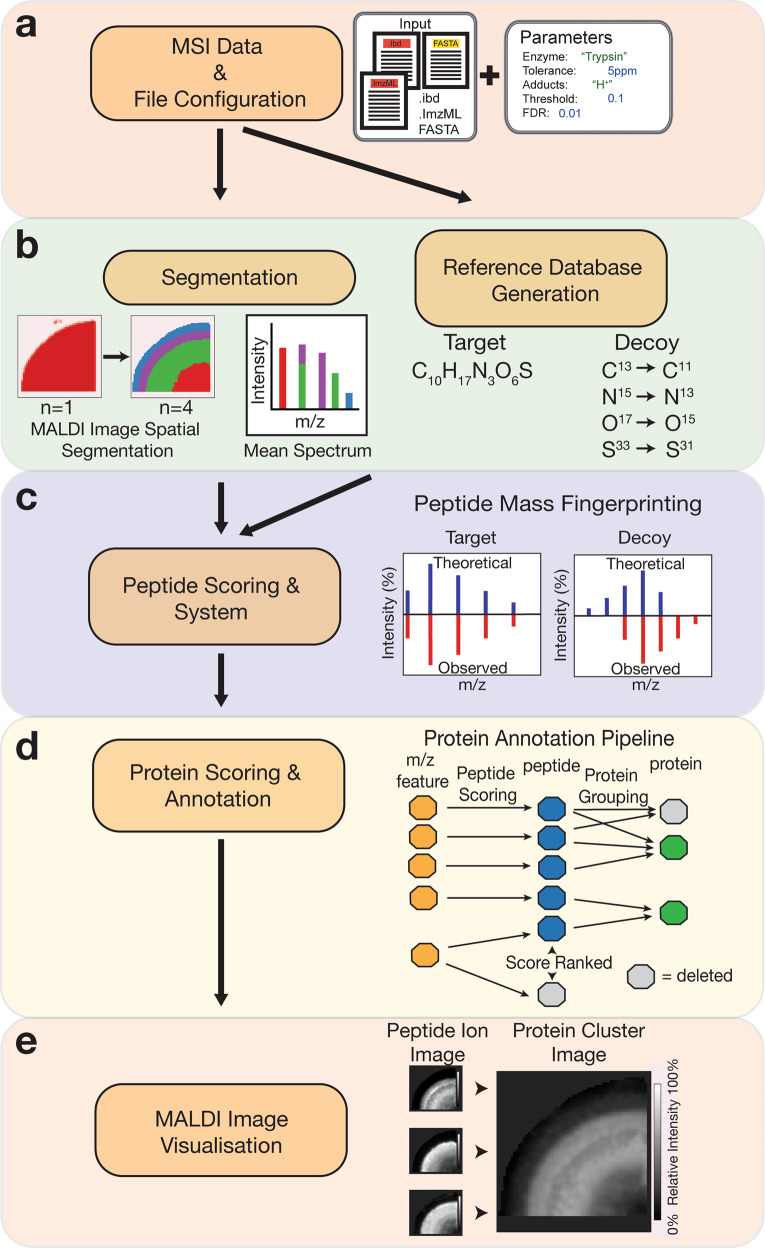
Fig. 1. Analysis workflow of HIT-MAP.
a HIT-MAP utilises as input.imzML and .ibd MALDI imaging datafiles as well as a reference proteome in FASTA format. Parameters including proteolytic enzyme, error tolerance and MALDI image segmentation number are configured in order to represent experimental conditions. b [left] Spatial clustering is performed on the MSI dataset producing a mean spectrum to increase the quality of the 2-D mass spectra. [right] The reference proteome is digested in silico to yield a target database to cross-reference to the MSI data, with a corresponding decoy database to statistically control peptide annotation. A series of c peptide and d protein scoring systems utilising a false-discovery rate target-decoy candidate list statistically controls analyte annotation. c Mass features are cross-referenced to the target and decoy databases using a peptide mass fingerprinting approach for peptide annotation, where competing peptides are competitively score-ranked. d Protein annotation utilises a peptide grouping strategy that eliminates protein subsets. e A customisable visualisation function spatially clusters peptide ion images of a parent protein, representing the summary protein spatial distribution across tissues.

