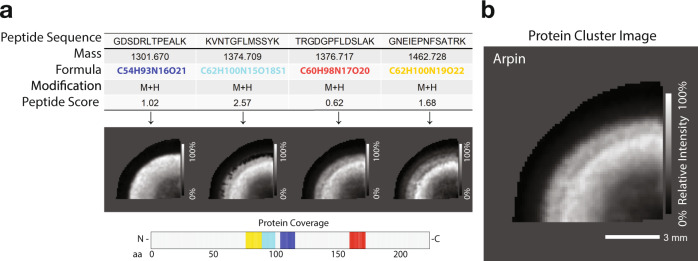
Fig. 2. Visualisation of HIT-MAP cluster imaging output in the bovine lens.
a Example outputs from HIT-MAP visualisation of bovine lens protein arpin, showing the series of peptide data and peptide ion image for a given parent protein, as well as protein coverage (scale bar = 3 mm). b Visualisation of the integrated clustering of each individual peptide ion image to demonstrate the overall summary spatial distribution of an annotated protein. Intensity scales represent relative intensity from 0 to 100%. Scale bar = 3 mm.

