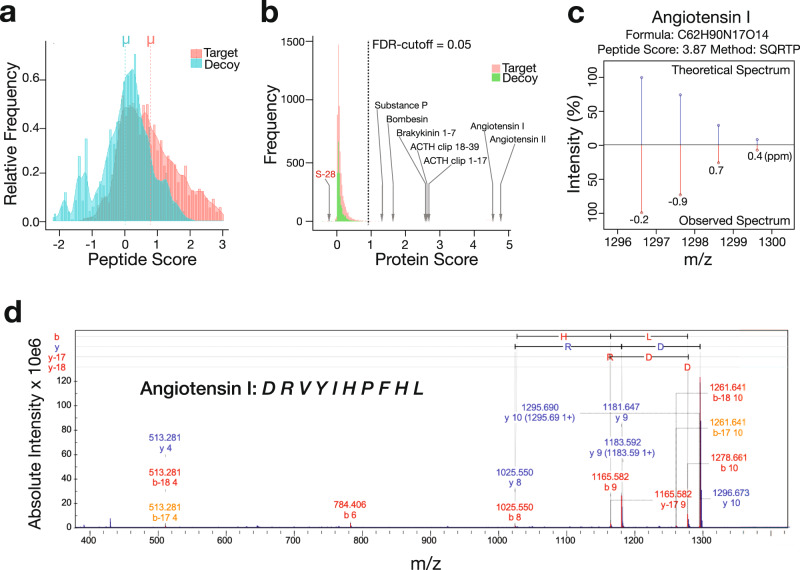
Fig. 3. Benchmarking of HIT-MAP against the Bruker Peptide Calibrant II.
The frequency distribution of a peptide and b protein target-decoy candidate list scores demonstrates the robust separation of our false-discovery rate (FDR) system accurately identifying 7/8 peptides. c Example of the HIT-MAP predicted and actual peptide mass fingerprint analysis of angiotensin I from the Bruker Peptide Calibrant. d Tandem MS/MS validation of angiotensin I identification in Bruker Peptide Calibrant spot. ppm = parts per million.

