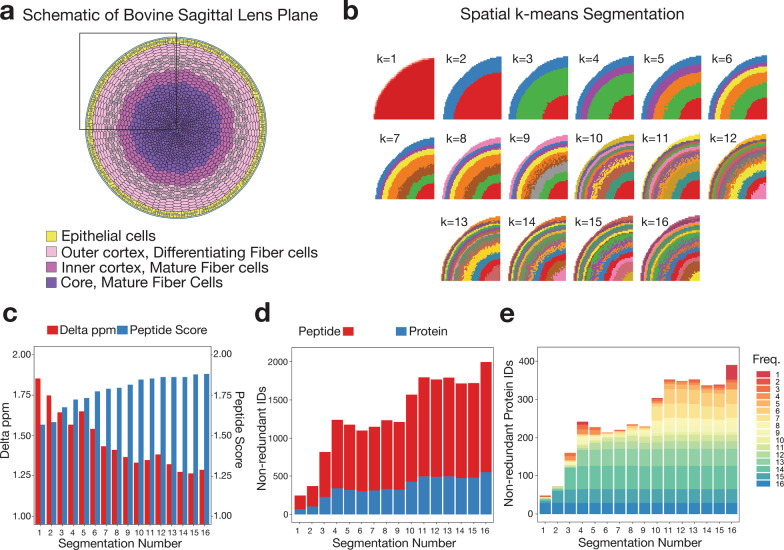
Fig. 4. Optimisation of segmentation analysis.
a Diagrammatic representation of the sagittal plane of the bovine lens detailing the 4 major anatomical regions. b HIT-MAP spatial k-means clustering of a MALDI–MSI lens dataset based on specification of between k = 1 − 16 data-driven segments (colours show individual segments). Note the unbiased annular segmentation in line with lens anatomy. c The median mass variance in exact mass-filtering of candidate peptides against m/z features within the experimental mass spectrum, and the subsequent median peptide score of m/z features shows improved peptide scoring and declining ppm error during exact mass filtering with increased segmentation. d The total number of non-redundant peptide and protein identifications by HIT-MAP with varying segmentation of the lens, and e the total number of non-redundant protein identifications by HIT-MAP with varying segmentation of the lens—protein IDs are grouped and coloured by their identification frequency across the serial segmentation test.

