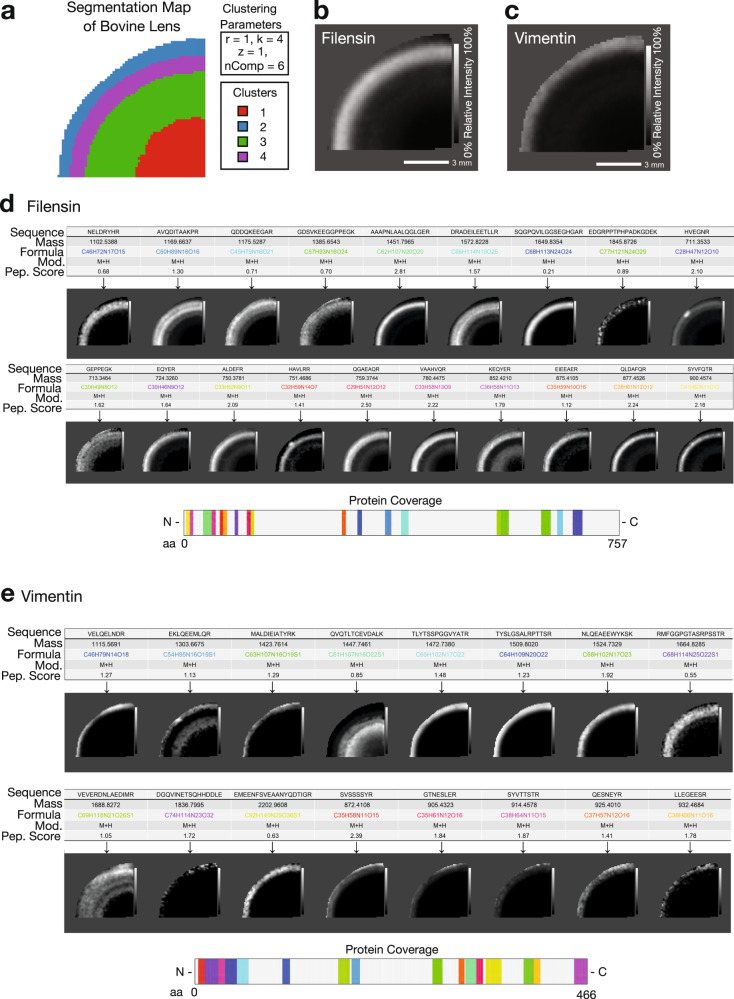
Fig. 5. Application of HIT-MAP to a bovine lens FT-ICR mass spectrometry imaging dataset.
a Spatial k-means clustering was performed on the bovine lens into n = 4 unsupervised segments based on prior knowledge of lens biology. b HIT-MAP protein cluster image of Filensin comprising 19 robustly annotated m/z features. c HIT-MAP protein cluster image of Vimentin comprising 16 m/z features. d Individual peptide distributions and protein coverage for Filensin shown in b (scale bar = 3 mm). e Individual peptide distributions and protein coverage for Vimentin shown in c (scale bar = 3 mm). Intensity scales represent relative intensity from 0 to 100%.

