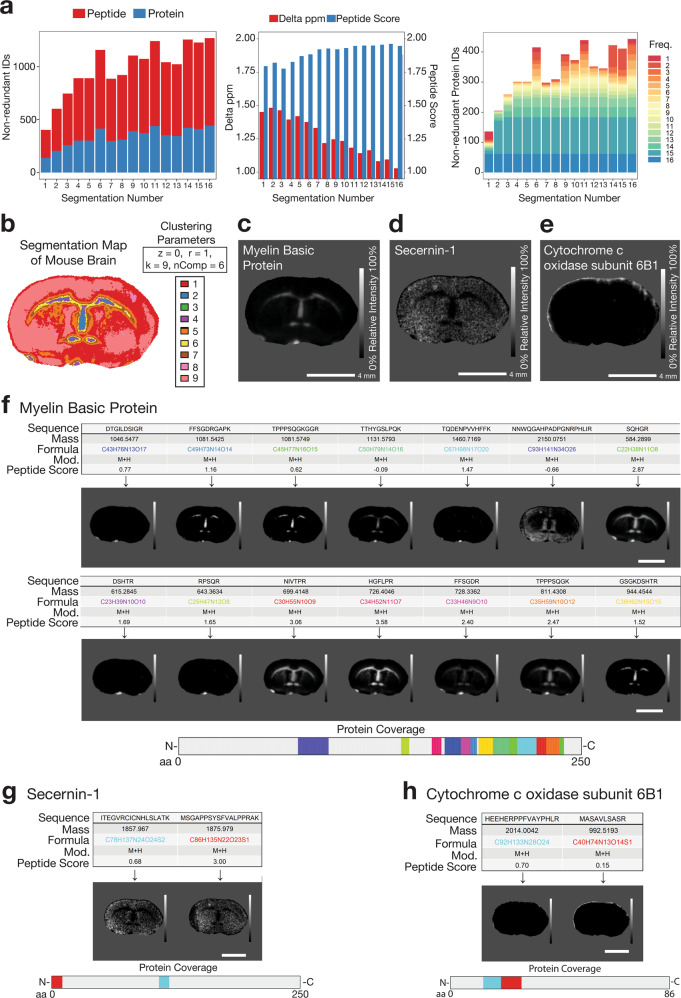
Fig. 7. Application of HIT-MAP to a murine brain FT-ICR mass spectrometry imaging dataset.
a [left] The total number of non-redundant peptide and protein identifications by HIT-MAP with varying segmentation of the brain. [centre] The median mass variance in exact mass-filtering of candidate peptides against m/z features within the experimental mass spectrum, and the subsequent median peptide score of m/z features with varying segmentation of the brain. [right] The total number of unique protein identifications by HIT-MAP with varying segmentation of the brain. Protein IDs are grouped and coloured by their identification frequency across the serial segmentation test. b Spatial k-means segmentation was performed on the brain using n = 9 segments. c HIT-MAP protein cluster image of Myelin Basic Protein. d HIT-MAP protein cluster image of Secernin-1. e HIT-MAP protein cluster image of cytochrome c oxidase subunit 6B1. f Individual peptide distributions and protein coverage for Myelin Basic Protein shown in c (scale bar = 4 mm). g Individual peptide distributions and protein coverage for Secernin-1 shown in d, (scale bar = 4 mm). h Individual peptide distributions and protein coverage for cytochrome c oxidase subunit 6B1 shown in e (scale bar = 4 mm). Intensity scales represent relative intensity from 0 to 100%.

