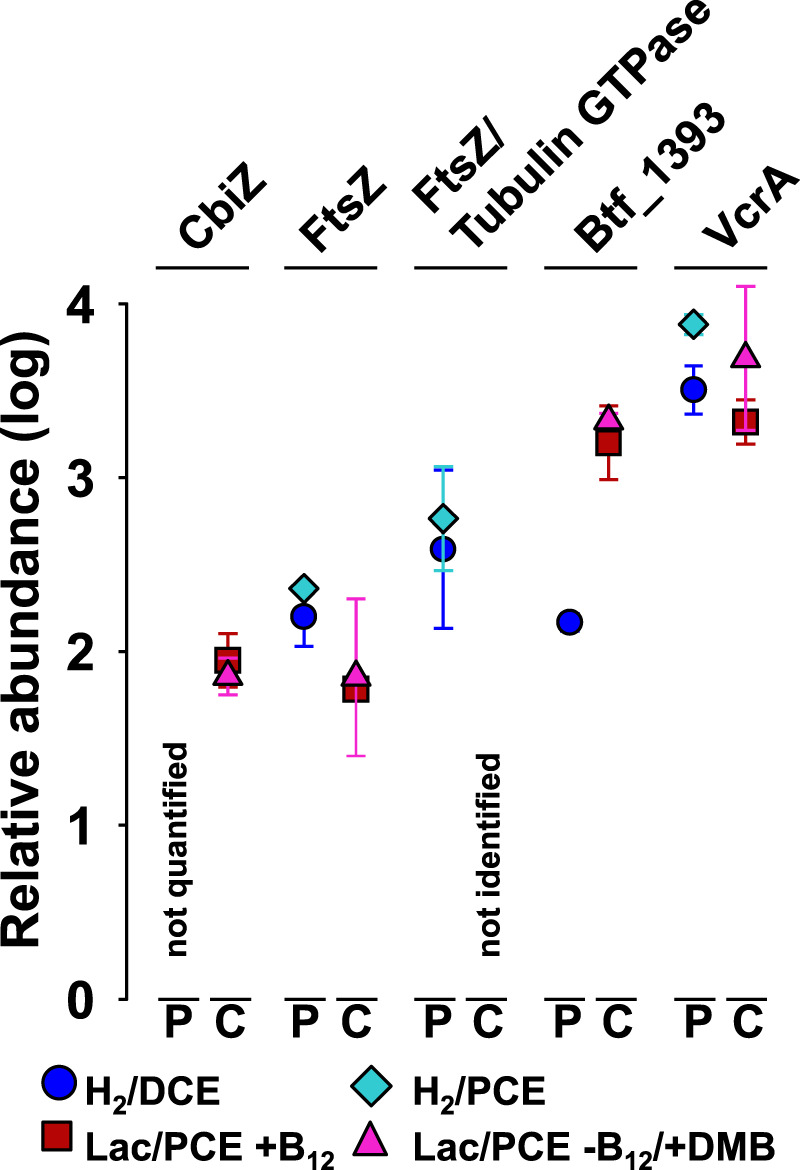
Fig. 5. Protein abundances of reductive dehalogenases and a set of significant indicator proteins of Dhc BTF08 in pure and co-cultures.

Average protein abundance values under different cultivation conditions are shown. Abundances represent log10 fold changes of the median, scaled to zero. The median of all proteins was at 2.3 (see Supplementary Fig. S18, which displays each replicate in a scatter plot graph). Four replicates (N = 4) were used for proteomic analyses; one of the four replicates was discarded from each of the D. mccartyi pure cultures (see Methods). Error bars represent standard deviation, which is covered completely by the symbol if <0.1. P—D. mccartyi strain BTF08 pure culture, C—Sm/BTF08 co-culture, CbiZ—adenosylcobinamide amidohydrolase (btf_610), FtsZ—cell division protein (btf_0595), FtsZ/Tubulin GTPase (btf_0551), VcrA—vinyl chloride reductive dehalogenase (btf_1407), btf_1393—reductive dehalogenase homolog to PteA (locus tag 11a5_1355) of D. mccartyi 11a5.
