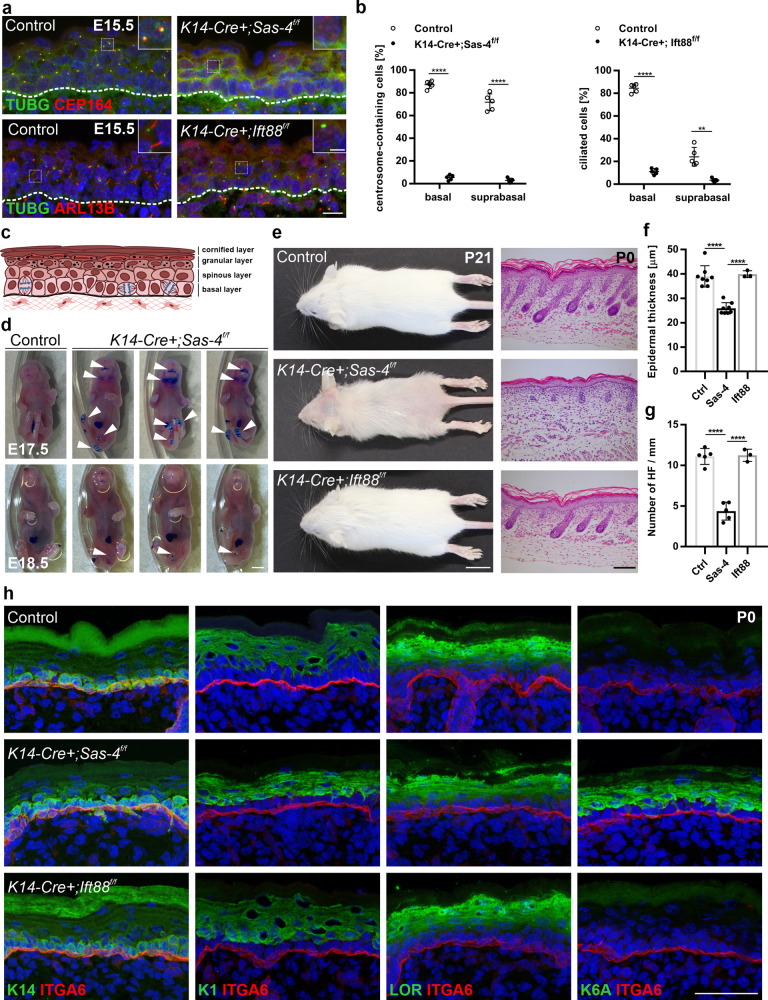
Fig. 1. Centrioles, not cilia, are important for proper epidermal and hair follicle formation.
a Immunostaining of control and K14-Cre+; Sas-4f/f or K14-Cre+; Ift88f/f back-skin sections at E15.5 showing the loss of centrosome and centriole markers (TUGB, green) and (CEP164, red) or cilia marker (ARL13B, red). Insets are magnifications of the indicated dotted areas in each panel. The dashed line represents the epidermal-dermal interface in all panels (scale bar: 10 µm; inset: 3 µm). b Quantification of the centrosome- or cilia-containing cells in (a) with n = 5 independent animals. **p < 0.01, ****p < 0.0001 (two-tailed student’s T-test). Bars represent mean ± SD (standard deviation). c Schematic of the epidermis depicting the different epidermal layers. d Toluidine Blue dye-penetration assay of Control and K14-Cre+; Sas-4f/f embryos at E17.5 and E18.5. Arrowheads indicate regions with delayed barrier formation in K14-Cre+; Sas-4f/f embryos (scale bar: 2 mm). e Gross phenotypes of Control, K14-Cre+; Sas-4f/f and K14-Cre+; Ift88f/f mice are shown at P21 (scale bar: 1 cm), as well as H&E histological staining of back-skin sections at P0 (scale bar: 100 µm). f, g Quantification of the interfollicular epidermal thickness (f), excluding the cornified layer, of Control (n = 8), K14-Cre+; Sas-4f/f (n = 8), K14-Cre+; Ift88f/f (n = 3) or the number of hair follicles (g) at P0 of Control (n = 5), K14-Cre+; Sas-4f/f (n = 5) and K14-Cre+; Ift88f/f (n = 3) mice. ****p < 0.0001 (two-tailed student’s T-test or one-way ANOVA and Tukey’s multiple comparisons test without adjustments). Bars represent mean ± SD. h Immunostaining of Control, K14-Cre+; Sas-4f/f and K14-Cre+; Ift88f/f back-skin sections at P0 stained for the epidermal layers’ markers K14, K1 and Loricrin (LOR) (all green), the activation marker K6A and the basement membrane marker Integrin-α6 (ITGA6, red) (scale bar: 50 µm).

