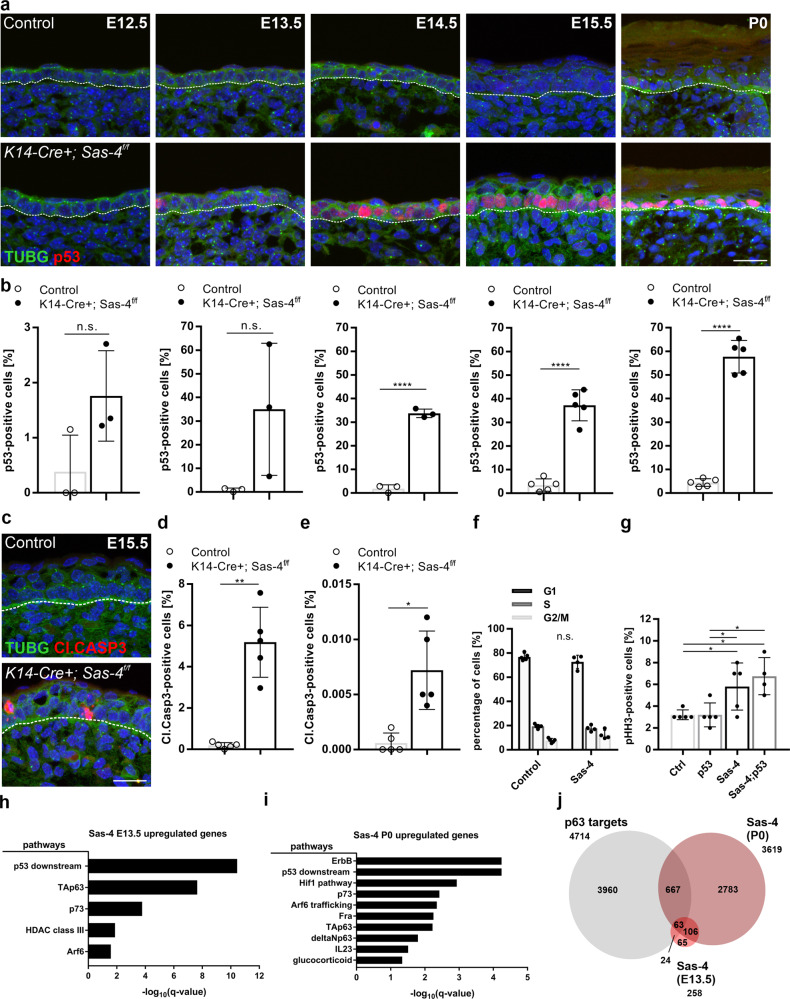
Fig. 2. Upregulation of p53 in the centrosome mutant epidermis.
a Immunostaining of Control and K14-Cre+; Sas-4f/f back-skin sections at the indicated stages showing the loss of the centrosome marker (TUBG, green) and gradually increase in nuclear p53 (red) in the mutant mice (scale bar: 20 µm). The dashed line represents the epidermal-dermal interface in all panels. b Quantification of the percentage of p53-positive nuclei in the back-skin basal epidermis of control and K14-Cre+; Sas-4f/f mice at the corresponding stage shown in (a). n = 3 for controls and K14-Cre+; Sas-4f/f from E12.5–E14.5 and n = 5 for Controls and K14-Cre+; Sas-4f/f at E15.5 and P0. Bars represent mean ± SD in these and subsequent graphs. ns not significant, ****p < 0.0001 (two-tailed student’s T-test). c, d Immunostaining (c) and quantification (d) of Control (n = 5) and K14-Cre+; Sas-4f/f (n = 5) back-skin sections at E15.5 for cell death (Cl.CASP3, red) in the mutant epidermis (scale bar: 20 µm). e Similar to (d) but at P0 with n = 5 for each genotype. d, e *p < 0.05, **p < 0.01 (two-tailed student’s T-test). f Cell cycle profiles of isolated primary keratinocytes at P0 of Control (n = 3) and K14-Cre+; Sas-4f/f (n = 3) mice. ns not significant (two-tailed student’s T-test). g Quantification of the percentage of pHH3-positive cells in the basal layer of back-skin epidermal sections at E15.5 of Control (n = 5), K14-Cre+; Sas-4f/f (n = 5), K14-Cre+; Sas-4f/w; p53f/f (n = 5) and K14-Cre+; Sas-4f/f; p53f/f (n = 4) mice. ns not significant, *p < 0.05 (two-tailed student’s T-test). h Bar chart depicting the over-represented pathways (from the pathway interaction database (PID)) of differentially expressed genes in the K14-Cre+; Sas-4f/f epidermis compared to controls at E13.5. The X-axis represents the negative log10 of the q-values, the adjusted p-values optimized by the false discovery rate. i Similar to (h) but for P0 epidermal keratinocytes. j Venn diagram showing the overlap of published p63 target genes36 with differentially expressed genes of K14-Cre+; Sas-4f/f at E13.5 and P0.

