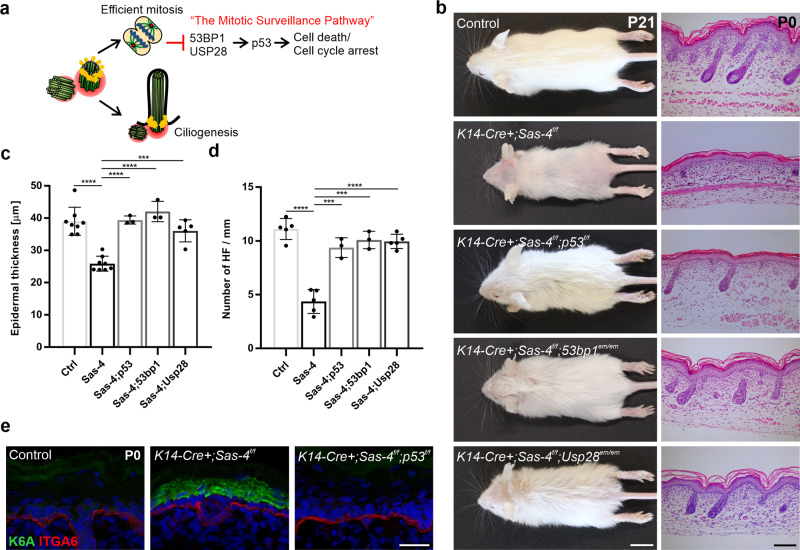
Fig. 3. The skin epidermal phenotypes in centrosome mutants are due to the activation of the mitotic surveillance pathway.
a Centrioles, besides providing the essential template for cilia, ensure efficient mitosis and repress the activation of the mitotic surveillance pathway: p53 stabilization mediated by 53BP1 and USP28 leading to cell death (mainly shown in vivo) or cell cycle arrest (mainly shown in vitro). b Gross phenotypes of Control, K14-Cre+; Sas-4f/f, K14-Cre+; Sas-4f/f; p53f/f; K14-Cre+; Sas-4f/f; 53bp1em/em and K14-Cre+; Sas-4f/f; Usp28em/em mice are shown at P21 (scale bar: 1 cm), as well as H&E histological staining of back-skin sections at P0 (scale bar: 100 µm). c Quantification of the interfollicular epidermal thickness (c), excluding the cornified layer, at P0 of Control (n = 8), K14-Cre+; Sas-4f/f (n = 8), K14-Cre+; Sas-4f/f; p53f/f (n = 3), K14-Cre+; Sas-4f/f; 53bp1em/em (n = 3) and K14-Cre+; Sas-4f/f; Usp28em/em (n = 5) mice. Control and K14-Cre+; Sas-4f/f animals are part of the same experiment in Fig. 1. d Quantification of the number of hair follicles at P0 of Control (n = 5), K14-Cre+; Sas-4f/f (n = 5), K14-Cre+; Sas-4f/f; p53f/f (n = 3), K14-Cre+; Sas-4f/f; 53bp1em/em (n = 3) and K14-Cre+; Sas-4f/f; Usp28em/em (n = 5) mice. c, d ***p < 0.001, ****p < 0.0001 (two-tailed student’s T-test or one-way ANOVA and Tukey’s multiple comparisons test without adjustments). Bars represent mean ± SD. e Immunostaining of Control, K14-Cre+; Sas-4f/f and K14-Cre+; Sas-4f/f; p53f/f back-skin sections at P0 for K6A (green) and ITGA6 (red) (scale bar: 25 µm).

