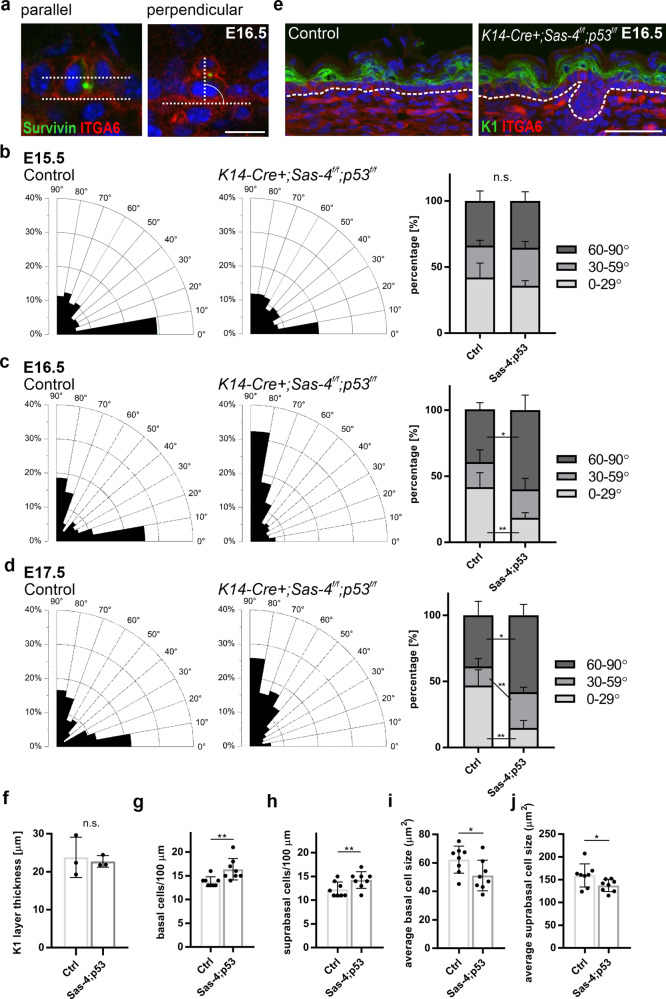
Fig. 4. The proportions of cell division orientation in the basal progenitors do not correlate with differentiation at late stages in Sas-4 p53 mutants.
a Representative image of parallel and perpendicular dividing basal cells from immunostaining (Survivin, green, and ITGA6, red) of back-skin sections of the interfollicular epidermis of Controls at E16.5 (scale bar: 10 µm). b Radial histograms of the distribution of the angles of cell division orientation in late anaphase to telophase of basal epidermal cells of Controls and K14-Cre+; Sas-4f/f; p53f/f animals at E15.5. Percentages of parallel (0–29°), oblique (30–59°), and perpendicular (60–90°) dividing basal layer cells of Controls (n = 3) and K14-Cre+; Sas-4f/f; p53f/f (n = 3) animals at E15.5. c Similar to (b) at E16.5. d Similar to (b) at E17.5 with n = 5 independent animals for each genotype and time point. b–d ns not significant, *p < 0.05, **p < 0.01 (two-tailed student’s T-test). e, f Immunostaining (e) and quantification (f) of the differentiated (K1-positive, green) layer in back-skin sections at E16.5 of Control (n = 3) and K14-Cre+; Sas-4f/f; p53f/f (n = 3) mice (scale bar: 50 µm). The dashed line represents the epidermal-dermal interface in all panels. g, h Quantification of the density (cells per 100 µm) of basal (g) and suprabasal (h) layer cells of sagittal back-skin epidermal sections of Controls (n = 8) and K14-Cre+; Sas-4f/f; p53f/f (n = 8) animals at E16.5. i, j Quantification of the average cell size of basal (i) and suprabasal (j) layer cells from (g) and (h), respectively, with n = 8 independent animals for each genotype. ns not significant, *p < 0.05, **p < 0.01 (two-tailed student’s T-test). Angle measurements were compared using a two-way ANOVA, Kolmogorov–Smirnov test, and Chi-squared test, all of which gave similar statistical significance outcomes. Bars represent mean ± SD.

