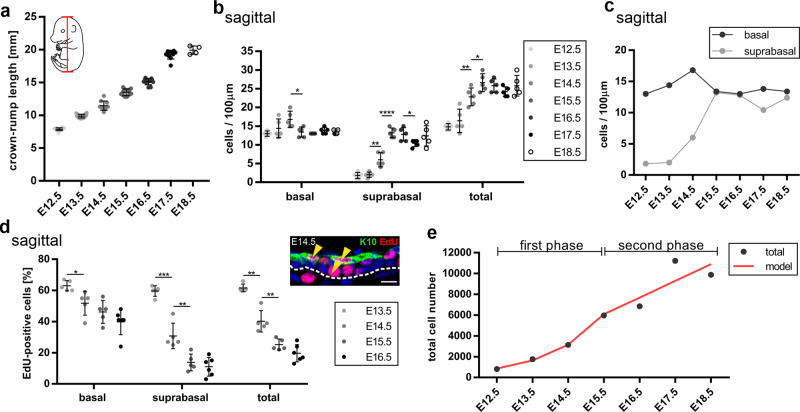
Fig. 6. Skin epidermal stratification occurs in two phases.
a Quantification of the crown-rump distance as depicted in the embryo schematic (red line) in wild-type embryos from E12.5–E18.5. Note the linear trend of the growth. E12.5: n = 10, E13.5: n = 16, E14.5: n = 10, E15.5: n = 12, E16.5: n = 11, E17.5: n = 10 and E18.5: n = 4 b, c Cell densities (cells per 100 µm) of basal and suprabasal layers of sagittal back-skin sections of the epidermis from E12.5–E18.5 with n = 5 independent animals for each time point. c The suprabasal cell density reaches parity with that of the basal layer starting at E15.5. d Quantification of EdU-positive cells in the basal and suprabasal layers from sagittal back-skin sections of the epidermis at the indicated time points, with an example of the EdU (red)/K10 (green) staining shown at E14.5 (arrowheads) (scale bar: 10 µm). n = 5 for E13.5–E15.5 and n = 6 for E16.5. e The graph depicts the exponential increase in total cell number in the first phase of stratification between E12.5–E15.5 and the linear-trend increase in the second phase between E15.5–E18.5, shown as the calculated total cell number from the measurements (total) and in agreement with the model (red line). *p < 0.05, **p < 0.01, ***p < 0.001, ****p < 0.0001 (two-tailed student’s T-test). Bars represent mean ± SD.

