
Fig. 4. Two-stage reaction process.
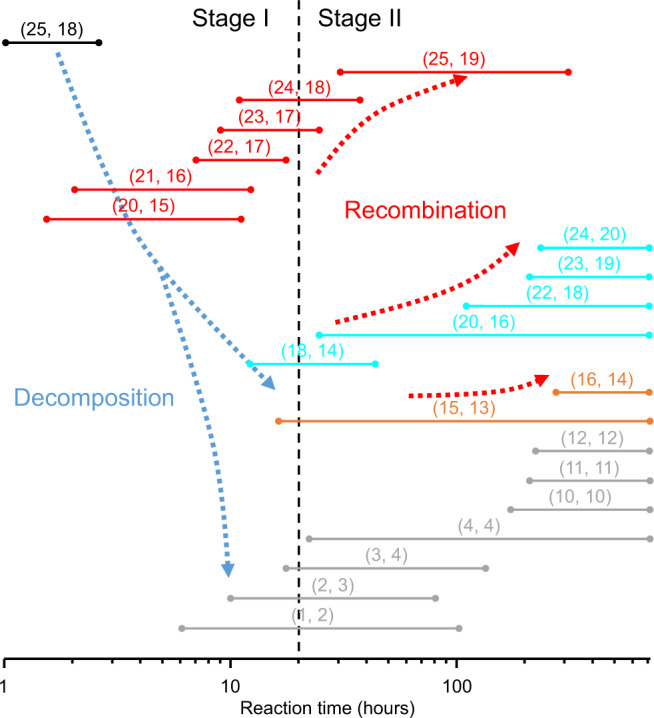
Segments representing the full width at half maximum (FWHM) of the normalized ESI-MS spectral intensity profiles in Fig. 2c. (m, n) denotes species with the molecular formula AumSRn. Species were classified by N* and marked with different colors. Black: N* = 7 and 8; red: N* = 6; cyan: N* = 4; orange: N* = 2; gray: N* = 0. Species with the same N* were arranged according to their relative size. The entire reaction process can be well divided into Stage I (decomposition process) and Stage II (recombination process).