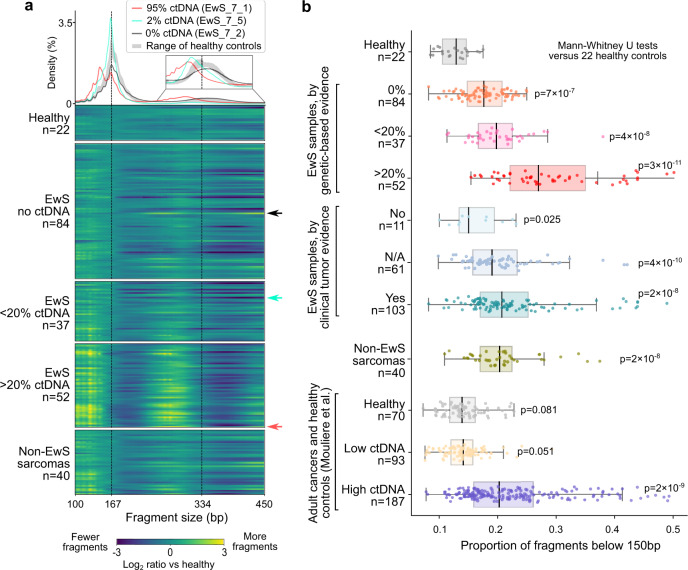
Fig. 2. Global fragment-size analysis detects highly fragmented EwS tumor DNA.
a Histogram (top) showing the cfDNA fragment-size distribution for three representative samples with high (95%), low (2%), and undetectable (0%) tumor-derived DNA (ctDNA) content. The range of cfDNA fragment sizes in 22 healthy controls is shown in gray. Heatmap (bottom) showing the relative fragment-size distribution of 235 cfDNA samples subjected to whole-genome sequencing, each normalized against the median of 22 healthy controls. EwS samples are grouped by genetically inferred tumor-derived DNA content. The three samples shown in the histogram are marked by arrows. b Proportion of short cfDNA fragments (20-150 bp) for pediatric sarcomas and healthy controls (data from this study) and for adult cancers (published data49). Boxes correspond to interquartile ranges (IQR), black lines indicate the median, and the whiskers extend to the lowest or highest data points that are still within 1.5 IQR of the bottom or top quartile, respectively. Significance versus the 22 healthy controls was assessed using two-sided Mann–Whitney U tests.

