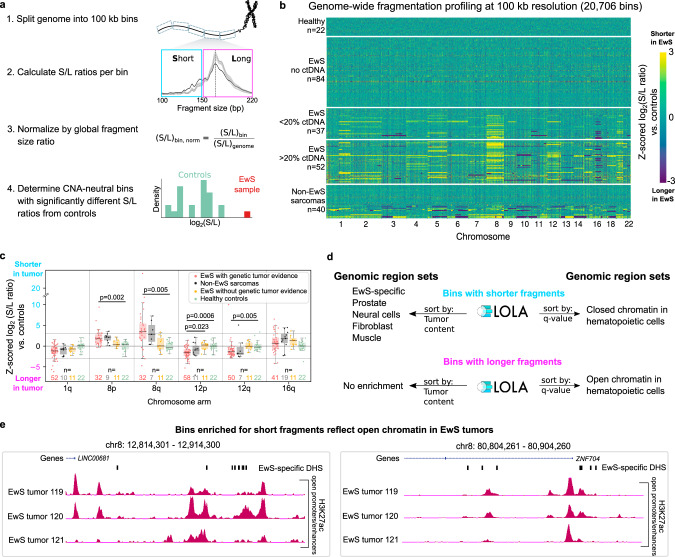
Fig. 4. Regional fragment-size analysis detects an EwS tumor-specific epigenetic signature in cfDNA samples.
a Schematic illustration of the regional fragment-size analysis, measuring the ratio of short (S) versus long (L) cfDNA fragments in 100 kb bins along the genome. Genomic regions that overlap with CNAs are excluded in order to focus the analysis on epigenetic signatures reflected in the cfDNA fragmentation patterns. b Heatmap comparing the genome-wide fragmentation profiles of cfDNA samples from patients with pediatric sarcoma to those of healthy controls. In each 100 kb bin (n = 20,706 bins), the log2(S/L ratio) of each sarcoma sample was compared to the distribution of log2(S/L ratios) of healthy controls via z-scores. Both CNA-affected and CNA-neutral bins are shown. EwS samples are grouped by genetically inferred tumor-derived DNA content. c Regional cfDNA fragmentation in patients with pediatric sarcoma compared to healthy controls. Only chromosome arms that are recurrently affected by CNAs in EwS tumors are shown. Box plots illustrate z-scores for EwS samples with genetic tumor evidence and without detected CNAs on the chromosomal arm (red), non-EwS sarcomas with genetic tumor evidence and without detected CNAs on the chromosomal arm (black), EwS samples without genetic tumor evidence (yellow), and healthy controls (green). The significance of the first group versus each of the other three groups was assessed using the two-sided Mann–Whitney U test; Bonferroni-corrected p-values are shown. Boxes correspond to interquartile ranges (IQR), thick black lines indicate the median, and the whiskers extend to the lowest or highest data point that are still within 1.5 IQR of the bottom or top quartile, respectively. d Functional enrichment analysis for regions with significantly shorter/longer cfDNA fragment size compared to healthy controls based on the LOLA software54. A selection of enriched terms is shown, while the full list is provided in Supplementary Data 6. e EwS tumor-specific epigenome profiles for selected regions with significantly shorter cfDNA fragment size compared to healthy controls. The genome browser profiles show open chromatin-associated histone H3K27 acetylation (for regions with shorter fragments) based on ChIP-seq data for primary EwS tumors41. EwS-specific DHSs along the selected genomic region are also indicated.

