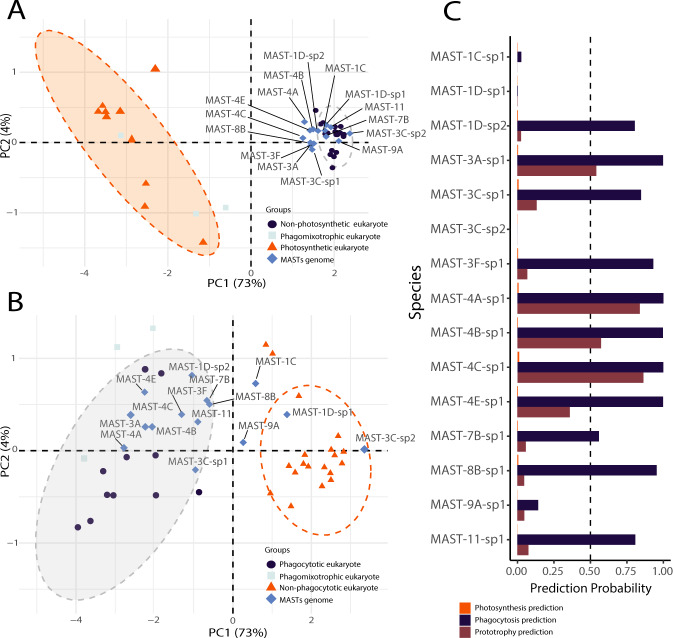
Fig. 2. Lifestyle prediction of MAST species using a comparative genomics model [45].
A Plot of two first principal components (PC1 and PC2) placing genomes based on their genes associated to GO categories defining the photosynthetic lifestyle. B PCA plot placing genomes based on their genes associated to GO categories defining a phagocytotic lifestyle. C Prediction probabilities for MAST species to the three lifestyles. Dashed line ellipses in A and B illustrate 95% confidence assessments of the groupings based on photosynthetic and phagocytotic predictions.

