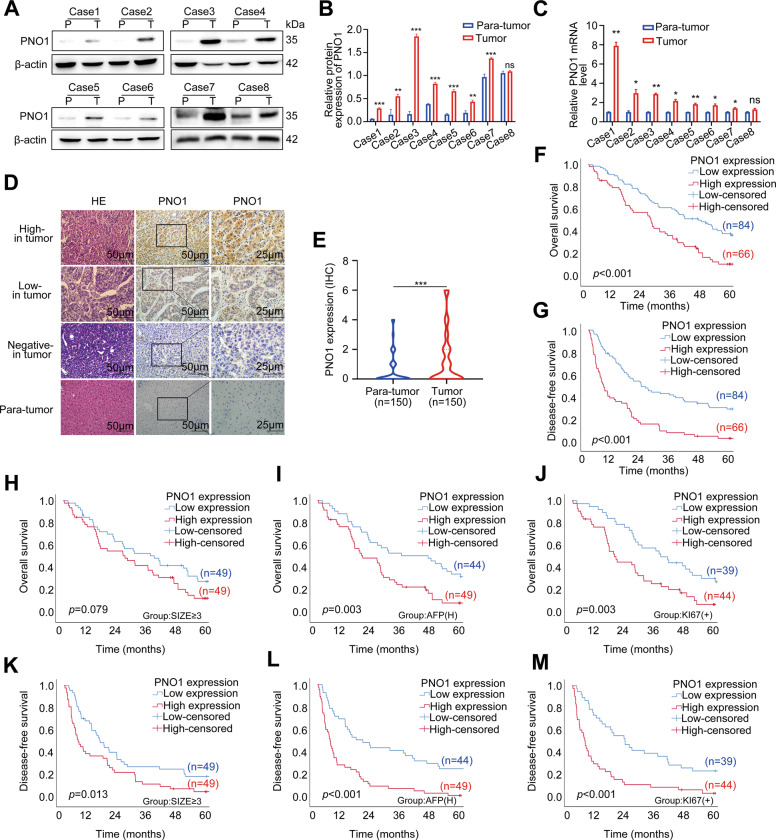
Fig. 1. PNO1 expression is elevated in HCC tissue samples and predicts poor survival in HCC patients.
A–C Western Blotting and RT-PCR showing the differences in the PNO1 protein and mRNA levels between eight pairs of HCC tissue (T) and adjacent normal tissue (P). D, E IHC analysis of PNO1 expression in 150 pairs tissue microarrays of HCC specimens. Representative images were taken at a magnification of 50 or 25 μm, p < 0.05. F, G The Kaplan–Meier survival analysis of overall survival (F) and disease-free survival (G) for 150 HCC patients. H, K The Kaplan–Meier survival analysis of overall survival (H) and disease-free survival (K) for HCC patients in tumor size ≥ 3 cm subgroup. I, L The Kaplan–Meier survival analysis of overall survival (I) and disease-free survival (L) for HCC patients in high serum AFP level subgroup. J, M The Kaplan–Meier survival analysis of overall survival (J) and disease-free survival (M) for HCC patients in a more positive rate of Ki-67 subgroup. Data were presented as mean ± SEM. n = 3–4. *p < 0.05, **p < 0.01, ***p < 0.001.

