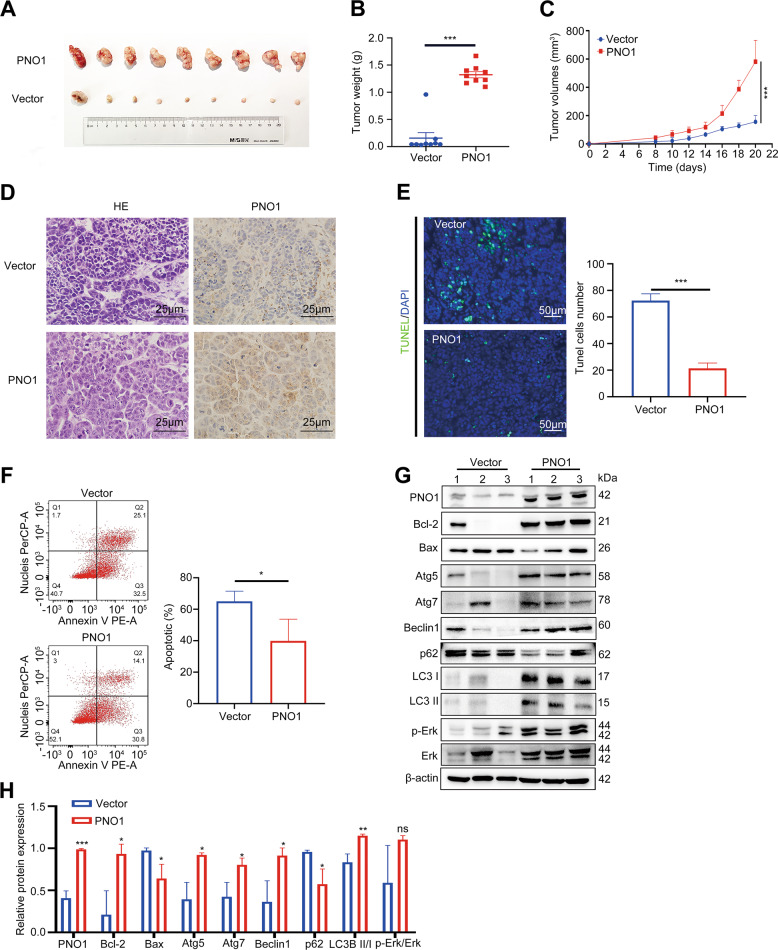
Fig. 5. PNO1 promotes HCC tumorigenesis in vivo.
A Images of tumors from nude mice in HLE Vector and PNO1 groups. B, C Tumor weights and volumes in the two groups. D IHC analysis of PNO1 expression in two groups. Scale bar: 25 μm. E Apoptosis was evaluated by TUNEL staining and quantification of TUNEL positive cells in two groups. Scale bar: 50 μm. F Apoptotic rate was measured using annexin V/PI double staining in two groups. G The protein level of PNO1 and MAPK signaling pathway markers in established xenograft model assessed by Western Blotting. H Quantification of relative protein expression. Data were presented as mean ± SEM. n = 3–4. *p < 0.05, **p < 0.01, ***p < 0.001.

