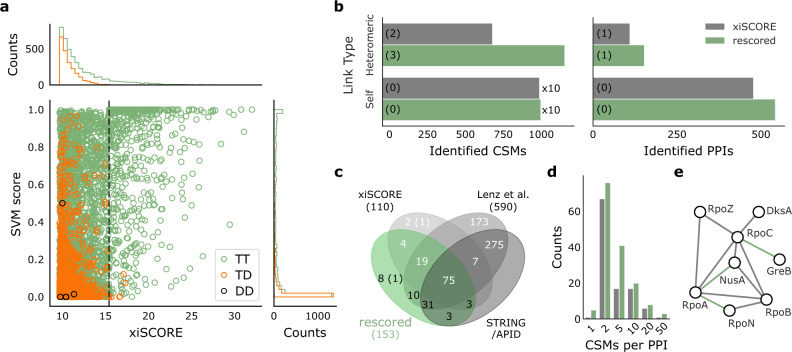
Fig. 4. Incorporation of RT prediction to CSM-scoring increases crosslink identification.
a Score distributions of heteromeric CSMs based on mass spectrometric information (xiSCORE) and retention time features (SVM score). The dashed line indicates the xiSCORE-based CSM-FDR threshold of 1%. b Increase in the identification of TT-CSMs and PPIs at constant FDR. Numbers in brackets indicate identifications involving a human protein. c Overlap of observed PPIs (at 1% heteromeric PPI-FDR) to external references. Numbers in the Venn diagram represent the identified PPIs among E. coli proteins or PPIs involving human proteins (in brackets). Black numbers highlight the added benefit from combining xiSCORE with xiRT’s SVM score for PPI identification. d Distribution of CSMs per PPI before (gray) and after CSM-rescoring (green). e Selected subnetwork of the RNA polymerase with PPIs only identified after the rescoring connected in green. Data in b–e correspond to a 1% PPI-FDR (prefiltered at a 5% CSM-FDR). Source data are provided as a Source Data file.

