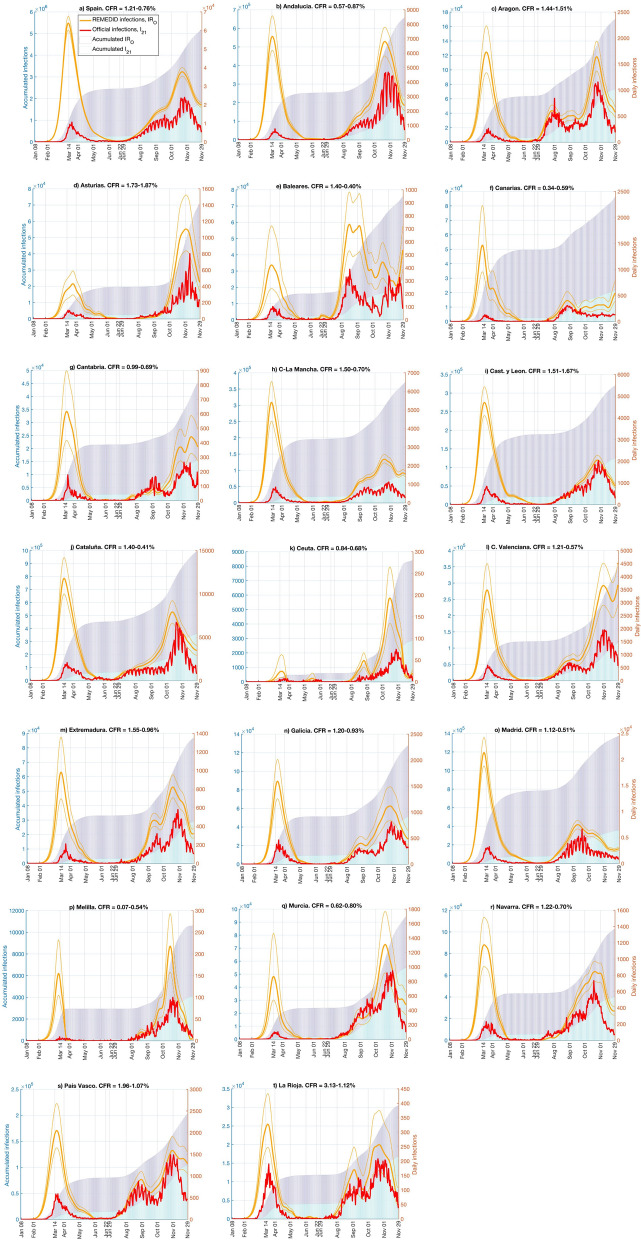
Figure 4.
Daily and accumulated infections for official COVID-19 daily infections (IO21), and daily infections estimated from COVID-19 deaths (IRO). Lines are daily infections and refer to the y-axis on the right; bars are accumulated infections and refer to the y-axis on the left. Red lines and cyan bars are official COVID-19 data; orange lines and blue bars are inferred infections with case fatality ratio (CFR) in Table 1. Thin orange lines correspond to the CFR confidence interval.

